
Tuesday Talk: Short Week - Up Or Down?
Good news regarding the CPI carried over into last Friday's session. As the market heads into the first day of a shortened trading week and the World Economic Forum in Davis starts its second day, the question is whether or not the good vibes will continue or will Thursday debt ceiling jitters spark a fall?

Friday the S&P 500 closed at 3,999, up 16 points, the Dow closed at 34,301, up 113 points and the Nasdaq Composite closed at 11,079, up 78 points. By all accounts the first half of January 2023 has been an up month for equities as the chart below shows.
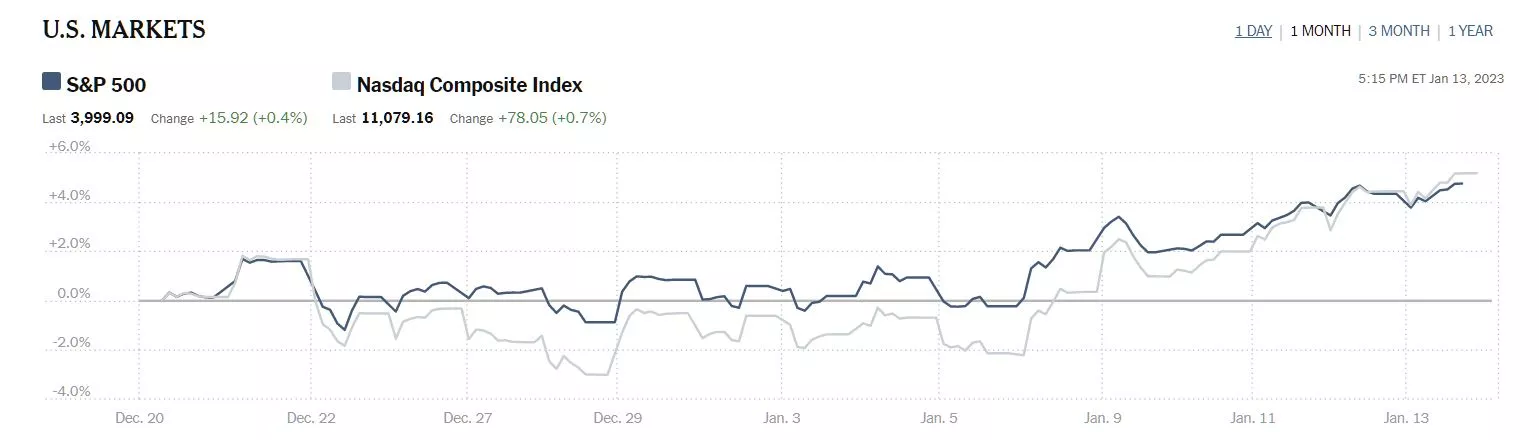
Chart: The New York Times
In Tuesday trading overseas, Asian markets closed mixed and European markets have started the day slightly lower.

Chart: The New York Times
In morning futures action S&P 500 market futures are trading down 11 points, Dow market futures are trading down 72 points and Nasdaq 100 market futures are trading down 47 points.
TalkMarkets contributor Harry Boxer asks if current market action is the Start Of A New Intermediate Uptrend Or A Rally Back To Resistance?
"The Indices had an important technical week last week, following through to the VERY strong upside reversal that occurred on Friday, January 6th. The Nasdaq 100 was higher all 5 sessions and closed the week at the highs going away, aided by strong performances from large-cap components AAPL, AMZN, MSFT, NVDA, and TSLA. That index gained nearly 500 points for the week! The S&P 500 also followed through nicely and managed to close near 4,000, gaining about 100 points for the week.
Advance/Decline ratios were quite positive and confirm the trends. Now the indices have overhead objectives near resistance to deal with at NDX 11,800 and 12,100 levels. The SPX resistance appears to be at 4,050-53 and near 4,100...
The KEY to action going forward is the interpretation of whether or not the conditions are a result of an initial thrust that starts a new intermediate uptrend or just another rally back to resistance in a bearish overall downtrend...The near-term action going forward may tell the tale of where this market wants to go.
The markets appear to be at a crossroads here, so pay close attention to what is revealed this week.
Remember: Trade what you see, not what you think."

About inflation, contributor Joseph Calhoun writes Maybe It Was Transitory After All.
"Stocks and bonds rallied as the Fed’s Whip Inflation Now project seems to be finally bearing some fruit. In reality, inflation peaked months ago but the Fed hadn’t really caught on yet – they’re a little slow – and the market has been fearing that they would go too far and cause a recession. But surely, the market seemed to say, the moderation is so obvious now that even Jerome Powell can see that he’s done enough...It is certainly true that inflation has cooled considerably since last year. The CPI is up a total of 0.9% over the last 6 months and if that keeps up, I’d say mission accomplished. But, relative price changes like these happen all the time and have nothing to do with real inflation, which is about the value of the dollar. Inflation is higher during times of dollar weakness. And the dollar has most certainly not been weak recently...The inflation we’ve experienced over the last year was real – prices really did rise – but it was not one driven by a weak dollar. It was driven by the pandemic distortions caused by massive government intervention in the economy that affected both demand and supply to a degree never seen before in modern times. In a sense, we had a supply and a demand shock simultaneously, although I’d put more emphasis on the demand side. Now, as the interventions fade – and yes they will fade over time – so will the effect. I would not expect prices to fall back to the previous level but the inflation rate should moderate – for now. With the dollar now back in the stability zone, the direction of inflation will likely depend on whether it can stay there...(Last week) was also a week of more speculative activity with small cap and growth stocks outperforming strongly. The CPI report last week firmed up the consensus around rate hikes (February is now a 94% chance of 25 basis points and the bet is that it will be the last one) and a soft landing is rapidly becoming the consensus. I’m reluctant to make that bet, at least for now. The economic trend is still weaker and until that changes I think you have to assume the trend will continue. The uptick in the University of Michigan consumer sentiment reading last week was encouraging but the near-term data seems likely to continue to show weakness..."
See the full article for more. It is full of good observations both current and historical of how to gauge what may be coming down the road.
Calhoun's conclusion for the week that was: "The dollar has only just come down from the danger zone and a rebound from here seems likely, at least short term. We may well avoid recession this year but that doesn’t mean it’s all clear for stocks and bonds. And there are still fairly good odds on a recession. Stay cautious…for now."
Still on the inflation front contributor Menzie Chinn looks at Demographic Variations In Inflation Expectations. There are several charts in the article. Below are two charts reflecting the most recent data; the first based on household income and the second based on level of education, and Chinn's summation of his findings. Go to the article for more data.
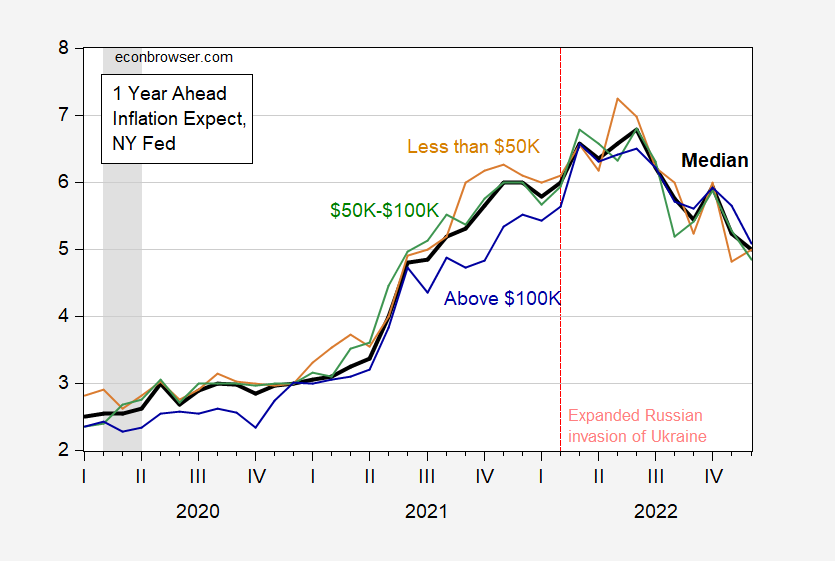
Figure 2: One year ahead expected CPI inflation median (bold black), for HH income below $50K (tan), between $50K-$100K (green), over $100K (blue), 2019M01-2022M12. NBER defined peak-to-trough recession dates shaded gray. Source: NY Fed, NBER.
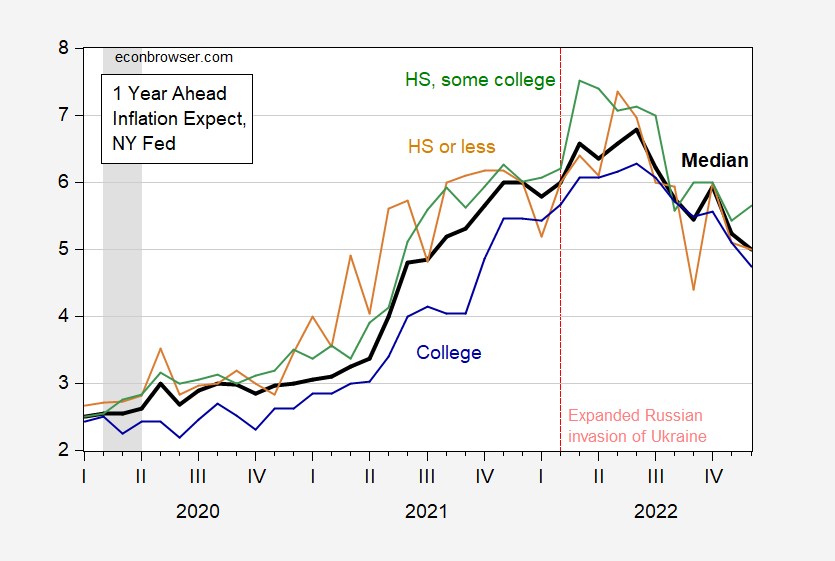
Figure 4: One year ahead expected CPI inflation median (bold black), for High School or less (tan), High School and Some College (green), BA or Higher (blue), 2019M01-2022M12. NBER defined peak-to-trough recession dates shaded gray. Source: NY Fed, NBER.
"Bottom line for forecasts by income groups — those with lower incomes tend to have higher forecasts of inflation. That’s true over the pre-pandemic period as well as after. The higher forecasted inflation rates might be due to the higher inflation rates experienced by these groups (that is higher expected inflation is associated with higher currently experienced inflation). Recall, the CPI is plutocratic, that is it represents the consumption bundle of a household at the roughly 70th percentile. It must be noted, thought, that on average, household expectations have been more upwardly biased than those from surveys of professional forecasters.
For educational achievement levels, it appears the degree of bias with respect to median expectations depends on the time period. For instance, high school or less respondents reported higher expectations in 2013-14, and again in 2021 and mid-2022. These are exactly times of upward movements in gasoline prices. In other words, these households weigh more gasoline prices than households with lower levels of educational achievement.
As for firms, Weber et al. (2022) note:
Observed price signals influence aggregate inflation expectations not just of households, but also of firm managers, who focus on the price signals that they observe in their industries. For example, firms in sectors that have witnessed higher inflation recently tend to form higher beliefs about aggregate inflation, even when those industry-level price changes are unrelated to aggregate price changes (Andrade et al. forthcoming). The importance of directly observed price changes as an individual-level signal that helps to explain aggregate inflation expectations is a pervasive finding in the literature.
TM contributor Mark Vickery below, takes note of some economic data releases set for this week which could impact market activity in his article, (On MLK Day), Taking Stock Of The Stock Market.

"Perhaps the biggest of these economic reports this week comes on Wednesday when Retail Sales for December is released. There are few more direct inflation metrics than monthly retail sales, and we are expecting a -1.0% downtick for last month, following a -0.6% drop the month before. Also, the final Producer Price Index (PPI) for December is also out Wednesday, expected to come in at -0.1% from a previous +0.3%.
And that’s only for starters: the Empire State manufacturing survey is expected tomorrow, and Industrial Production/Capacity Utilization is on Wednesday. Then the Philly Fed survey gets to us on Thursday, for a decent swath of our Manufacturing picture all told, both regionally and throughout the country. For Housing, there’s the Homebuilders Index Wednesday, Starts and Permits on Thursday, and Existing Home Sales Friday. Employment gets registered by Thursday’s Weekly Jobless Claims and Continuing Claims."
In the "Where To Invest Department" contributor Joshua Warner takes a look at Netflix Q4 Earnings Preview: Where Next For NFLX Stock?. Netflix is set to report Q4 earnings on Thursday.

" Wall Street forecasts that Netflix (NFLX) will report a 1.6% year-on-year rise in revenue in the fourth quarter to $7.83 billion, ahead of the guidance provided by the company for sales of $7.78 billion.
Operating income, its headline earnings measure, is expected to plunge 43% from last year to $362.4 million while diluted EPS is set to suffer a sharper fall of almost 70% to $0.41. Still, the market consensus is ahead of Netflix’s guidance for quarterly operating profit of $330 million and EPS of $0.36.
Netflix had one of its toughest years ever in 2022...The spike in popularity seen during the pandemic as people searched for entertainment whilst stuck at home during lockdown unwound and led to growth stalling before declining for the first time in the streaming company’s history. This caused it to lose its crown to rival Disney (DIS), severely dented confidence and resulted in its share price more than halving in 2022."
Those are the headlines, the full article provides an excellent profile of the current state of Netflix affairs. Warner's prognosis for the stock at this juncture is as follows:
"Netflix shares have risen over 90% since hitting their lowest level in almost five years back in May and the stock now trades at a nine-month high.
The stock continues to rise in the uptrend that can be traced back to those lows we saw in 2022, although it is yet to close the gap created in April 2022 when shares plummeted after it lost users for the first time on record. It needs to close above $333.22 to close it. We could see it climb toward $356.80, marking the level of support seen in early 2020, before eyeing a potentially larger move up to $396.50.
On the downside, we are seeing the RSI approach overbought territory to suggest that it may be more difficult to find higher ground going forward. The 50-day moving average has been providing a very loose form of support since last July but the 100-day moving average has proven more reliable. Notably, the 200-day moving average is currently aligned with the $250.30 level of resistance-turned-support seen throughout most of last year."
As always, caveat emptor.
Have a good one.

More By This Author:
Thoughts For Thursday: All Eyes On The CPI
Monday Musings: Indicators and Anticipation
Tuesday Talk: Continuing Yuletide Cheer?


