
Indicators are pointing to recession in Germany and show that the U.K. is/may be in one and depending on who you read or listen to the U.S. headed for recession in H1 or H2 of 2023. However anticipation of Fed rates cuts later in the year or fewer or slower rate increases moved the stock market higher on Friday. A persistently tight job market in the U.S. is also said to slow recession winds.

Investors seemed to be betting on a plentiful catch on Friday as the shortened, first trading week of 2023 ended strongly in the green. The S&P closed at 3,895, up 87 points or 2.3%, the Dow closed at 33,631, up 701 points or 2.1%, and the Nasdaq Composite closed at 10,569, up 264 points or 2.6%.
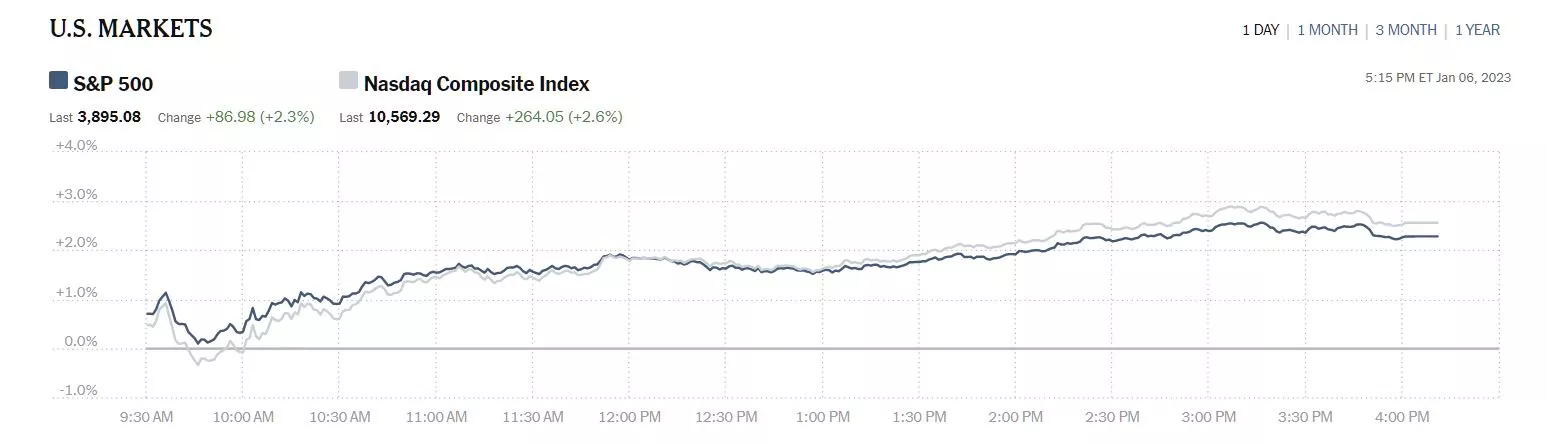
Chart: The New York Times
Top gainers were led by First Solar (FSLR), up 7.8%, followed by Costco (COST), up 7.3% and Old Dominion Freight (ODFL), up 6.8%. Additionally, semiconductor equipment manufacturers Applied Materials (AMAT) and KLA Corp. (KLAC), were up 6.5%.
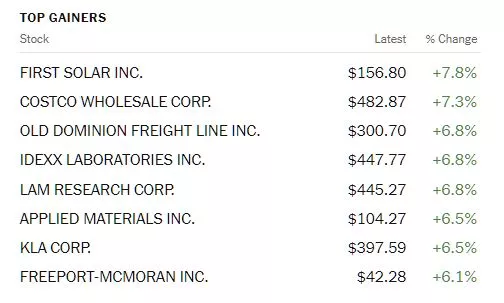
Chart: The New York Times
Asian markets closed up today and European markets have started the trading day mixed/edging up.
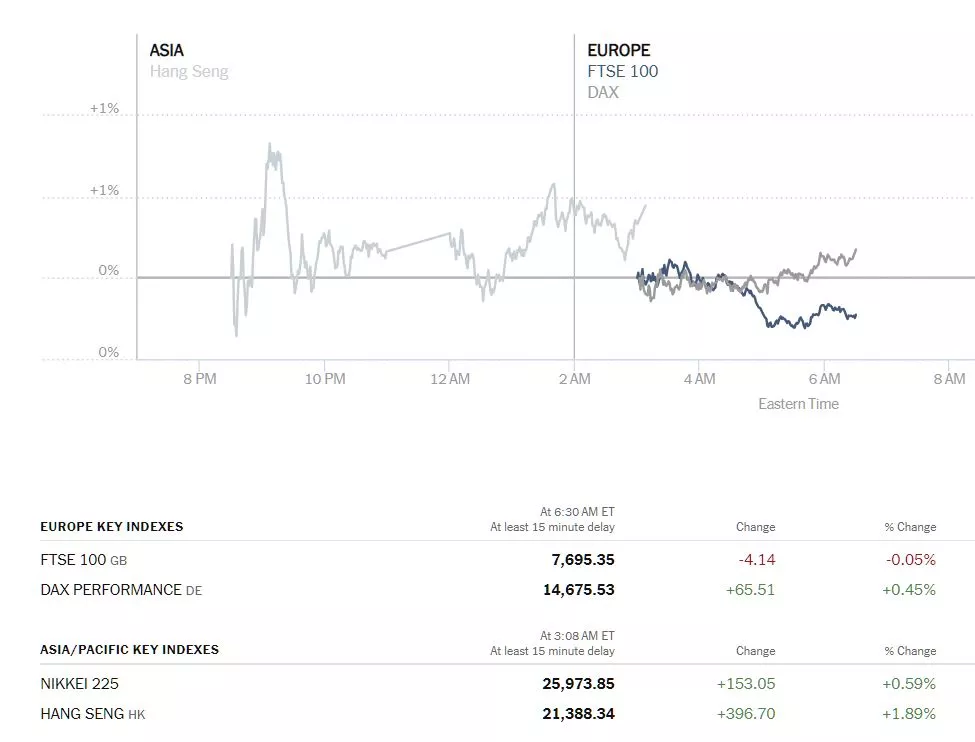
Chart: The New York Times
In early morning futures action, S&P market futures are up 15 points, Dow market futures are up 91 points and Nasdaq 100 market futures are up 44 points.
TalkMarkets contributor Patrick Munnelly provides some further insight into overseas markets noting that the MSCI Asia Pacific Index (Is) In Bull Market Territory.
"Asian equity markets took their lead from Friday's positive close to trade on Wall Street, with US equity markets posting their best gains for over a month...improved risk sentiment has driven the Asia Pacific MSCI index back into bull market territory, gaining 20%+ from the lows, the index has been given a further boost by the China re-opening story, with the region removing quarantine restrictions for inbound passengers."

"In the UK there is no tier-one economic data of note today, investors will parse comments from the Bank of England Chief Economist, Huw Pill, who speaks at a conference at the New York University later today, Pill voted for a 50bps rate increase at the December meeting...investors will look for further confirmation of a 50bps move at the next BoE meeting.
In the Eurozone, the focus will be on unemployment data which is expected to remain in the 6.5% ballpark, this release will be coupled with the Eurozone investor confidence report, and market watchers are anticipating modest improvement from the December -21 print, consensus suggests an uptick to -18 for January."
Contributors Keith Schneider and Donn Goodman give their take on What's In Store For 2023?
"What does 2023 have in store for investors?
There are numerous (and differing) opinions out there. I have seen very conflicting point of views. Are you aware that virtually no economists or brokerage analysts accurately predicted hitting the 3800 level on the S&P for year-end 2022? Most of them had it pegged at well above 4200. The average prediction was for 4400 for the year-end (which would have still been a 10% decline on average).
The most recent opinions seem to be centered around 4200 to 4400 for year-end 2023. However, based on much of the analyst rhetoric I read daily, we could take some difficult paths to get there. Some suggest we will see the 3200 level (or lower) first, and then a sharp rally to above 4500 before we come back to 4200 before the end of the year.
If we do get somewhere between 4200 to 4400, that would produce an approximately 10%-15% return (with dividends) in 2023. We, however, are not predicting this.
If this occurred almost 12 months from now, it would be considered a positive year. It would also put us back into a year of asset growth. Below is a chart that depicts the possibility that we have a favorable year ahead, as the mapping indicates that pre-election years historically have a high chance of favorable markets, according to Oppenheimer & Co analysts."

"According to Yale Hirsch and the Stock Trader’s Almanac, there are three potential indications for a good investment year. These are the Santa Claus Rally (SCR), the First Five Days (FFD), and the January Barometer (JB).
Wednesday, we finished the famous SCR. Friday finished the FFD. Both were positive. The JB can only be calculated after the month of January. However, to give you a better idea and the positive effect the SCR, FFD and JB have had so far, please review the chart below.

"Typically, when the SCR is positive and the FFD is positive, the JB is usually positive. Therefore, there is a high likelihood this portends better things for the stock market (S&P 500) this year."
See the article in its entirety for a fuller picture.
In an Editor's Choice column, TM contributor John Mauldin looks to many contributing factors to what he calls the Year Of The Pause. The article deserves your full attention, but below are some of the things that Mauldin is considering as 2023 unfolds:
"The key to this year’s economy is in Jerome Powell’s hands. That’s certainly not ideal, but it is reality. I would much rather market forces be the key to understanding the future, but Powell is, unfortunately, in that role."
"(After the Russian invasion into Ukraine) the NATO countries and other democracies united to impose harsh sanctions on Russia, despite the near-certainty of negative effects on their own economies. Energy prices spiked, aggravating the already-rising inflation trend. Fed officials finally woke up in March and have raised rates at every meeting since then. They’re also slowly shrinking the balance sheet, i.e., “quantitative tightening” or QT."
"Economist Jason Furman tracks a modified Core CPI that substitutes “spot” rental rates for official calculations. This is a better way to think about where inflation (at least the way we measure it) is going. The improvement is quite evident in his chart.

Source: Jason Furman
What that tells us is that housing costs are going to be a significant disinflationary force in 2023. It doesn’t mean inflation is disappearing; housing is a big living cost, but not the only one. It simply suggests the worst fears likely won’t materialize.
I think data like this is what let the FOMC dial back the hiking pace to only 50 points in December, and if it continues, probably less in the next few meetings.
That brings us to my one specific forecast: I have been saying for over a year that I believe the Fed funds rate will get to 5%. I now believe it is entirely possible the Fed will not stop hiking until it gets to 5.5%."
"We are presently sitting amidst several large and growing financial system sandpiles, any or all of which could collapse at any time with potentially catastrophic effects...
This is my biggest fear entering 2023. Not that the Fed will make another mistake or inflation will get too high, but that the higher rates the Fed is (properly, if belatedly) using to fight inflation will set off a sandpile avalanche somewhere else. So many people and institutions are overleveraged. The sandpile walls are collapsing on them. Like the Fed, they have no good choices, but unlike the Fed, they have financial limits.
We are already seeing this in Silicon Valley, where years of cheap or free capital sustained companies that should have gone out of business long ago. Their ideas, while often noble and worth trying, just don’t work in the kind of “normal” economy the Fed is producing.
Every debt has two parties: borrower and lender. When the borrower defaults, the lender loses. But the lenders are often borrowers, too, in a vast web of interconnected global debt. Take out a few key connections, and it can all fall apart. I think we are dangerously close to learning how bad it can be."

"Too many stocks are simply overvalued relative to the profits they can generate in this kind of economy. If you can get 4%–5% on Treasuries, why reach for yield in a risky stock market?
The good news: This repricing will, in due course, give us opportunities to take wise risks on solid businesses and assets. I already have my eyes on several candidates. This year will be a time to identify your own opportunities, even if it’s not yet time to grab them."
TalkMarkets contributor Monica Kingsley (with a suggestion for the Fed, perhaps) writes Less Tightening For The Win.
Here are two of her thoughts, one on the S&P 500 (SPX) and one on crude oil (BNO):
"A less-tightening win – that‘s what S&P 500 needs – and with my patient call of the upside resolution to the recent range being more probable. For all the excitement of making another great call, don‘t lose the big picture view.
The not overly hot jobs figure allows for the Jan top to be made, with the first objective to be completed, being the upside break of 3,875."
"Crude oil, this laggard of 2023, is hesitantly starting to move as well, but don‘t expect miracles too soon or too fast. Still worth holding here for more upside though. As 2022 was the year of energy, 2023 would belong to metals and agrifoods."
The Staff at Investing Haven asks if there is Sufficient Liquidity In The System To Avoid A Recession?
"There is an enormous fear among investors of an upcoming recession...In fact, there is a solid case to be made that a ‘rolling recession’ hit the world in 2022, and that it is near completion. If our thesis is true, then there will be no stock market crash in 2023. That said, here is one really interesting data point that confirms our thesis which supports most (if not all) of our 2023 forecasts.
The data point below is M2, one of the measures of the money supply...
One of the ways to bring some context to the M2 money supply trend is by looking at it in a relative way. The chart below does just that, as it looks at M2 as a ratio of nominal GDP.
The economy remains awash in liquidity, with the ratio of M2 to nominal GDP (i.e., the reciprocal of M2 velocity) still near its recent record high, 84% during Q3'22, as shown by the chart.
We picked this chart because it tells us something about liquidity. Here is the point: if the market was about to start a market crash, it would occur due to absence of liquidity. All previous crashes came with a credit crunch. There are no such signs today, that’s what the chart below tells us.

Image Source: Yardeni Research
Closing out today's column with a slightly contrarian view contributor Michael Kramer in 6 Monster Stock Market Predictions For The Week Of Jan. 9 says this about Friday's rally in the stock market.
"S&P 500 (SPY)
Friday’s rally made little sense, given the strong unemployment reading and recessionary-like numbers from the ISM Services report. The rally was twofold, driven by a weaker dollar and implied volatility declining sharply. During the past year, we have seen these types of rallies over and over.
The rally looks like a cup, an up-sloping handle, or a rising flag. The outcome will likely be the same in either case, an index that reverts to 3,800."

Caveat Emptor.
Have a good one.
More By This Author:
TalkMarkets Image Library
Thoughts For Thursday: Will 2022 End With A Bang, And If So, What Kind?
Tuesday Talk: Continuing Yuletide Cheer?


Comments
Log in or sign up to join the conversation.