
All eyes are on the release of the December Consumer Price Index data later today. 2023 has started as a relatively up year for equities and a continued downward trajectory for the CPI seems necessary to keep the rally going.

Inflation is expected to have dropped to 5.7%, by some estimates and that was enough to keep stocks going higher on Wednesday. At the close of trading the S&P stopped at 3,970, up 50 points, the Dow gained 269 points, closing at 33,973 and the Nasdaq Composite closed up 189 points at 10,932.
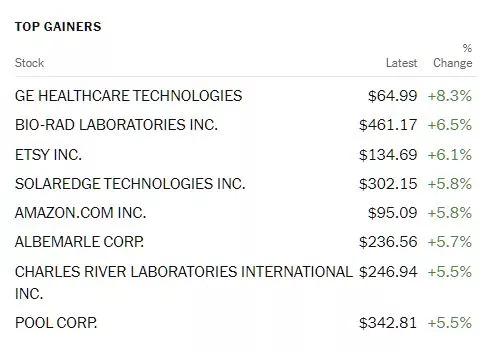
Chart: The New York Times
Top gainers reflected the robustness in the Nasdaq with Bio-tech and Tech related issues taking the lead. Newly listed GE spin-off, GE Healthcare (GEHC) gained 8.3%, followed by Bio-Rad Labs (BIO), up 6.5% and online specialty retailer Etsy (ETSY), up 6.1%.
In morning trading S&P 500 market futures are trading down 1 point, Dow market futures are down 1 point and Nasdaq 100 market futures are trading down 13 points.
Contributors Chris Turner, Frantisek Taborsky and Francesco Pesole at ING Economics write that the CPI To Press Play/Pause On The Rally.
"It has been a relatively good start to the year for risk assets. Global equity indices are up around 3.7%, led by Europe. Bond indices are up a decent 2-3% and emerging market assets are in demand, with EM local currency bond indices up close to 3%. This environment of money being put to work has weighed on the defensive dollar, which is softer against many emerging market currencies and quite a few G10 currencies.
This benign environment has been secured partially on the back of soft US price and activity data. Softer US price data has come both in the form of hard data and through surveys. Today sees the release of the December US CPI. Expectations are that the core will be rising at a relatively subdued 0.3% month-on-month pace and 5.7% year-on-year. This compares to 0.6/0.7% MoM readings last summer. As always, there are many moving parts in the data. For example, will medical costs and used car prices continue to drag the number lower? And does it remain too early to expect lower rental prices to drag shelter costs - a big component - down? Recently, the Federal Reserve has been highlighting that it is focused on the core services inflation reading ex-housing. So let us see what that number offers today. ING's US James Knightley is on consensus forecasting the 0.3% MoM/5.7% YoY reading.
A number in line with consensus probably allows the risk rally to continue."

TM Contributor Jesse of Jesse's Cafe Americain takes a poetic view of things in Stocks And Precious Metals - A Whiff Of Bullishness - CPI Tomorrow
"Stocks caught a whiff of bullishness and rallied hard into the close.
The VIX was largely unchanged.
The Dollar was unchanged.
Gold was unchanged, while silver edged a little lower.
The market has its eyes on the CPI data tomorrow morning.
The stock bullies are chomping at the bit it seems.
Everyone else, not so much.
I have no special insights. Let's see what happens."
See the article for Jesse's charts.
TalkMarkets Contributor Greg Feirman takes issue with the drill-down explanations of some economists when analyzing the CPI in his article, CPI Wonks Are Focused On The “Supercore”.
"I apologize in advance if this blog makes your head explode. But apparently, it is no longer enough to focus on the headline CPI or even core CPI. CPI wonks are focused on the “supercore”, according to a WSJ article by Sam Goldfarb."
"Why the distinction between headline and core to begin with? Because core strips out volatile food and energy prices to give a supposedly more pure reading of underlying inflation. The “supercore” strips out even more prices to give an even purer read on inflation. Think of it as the Platonic form of Inflation.
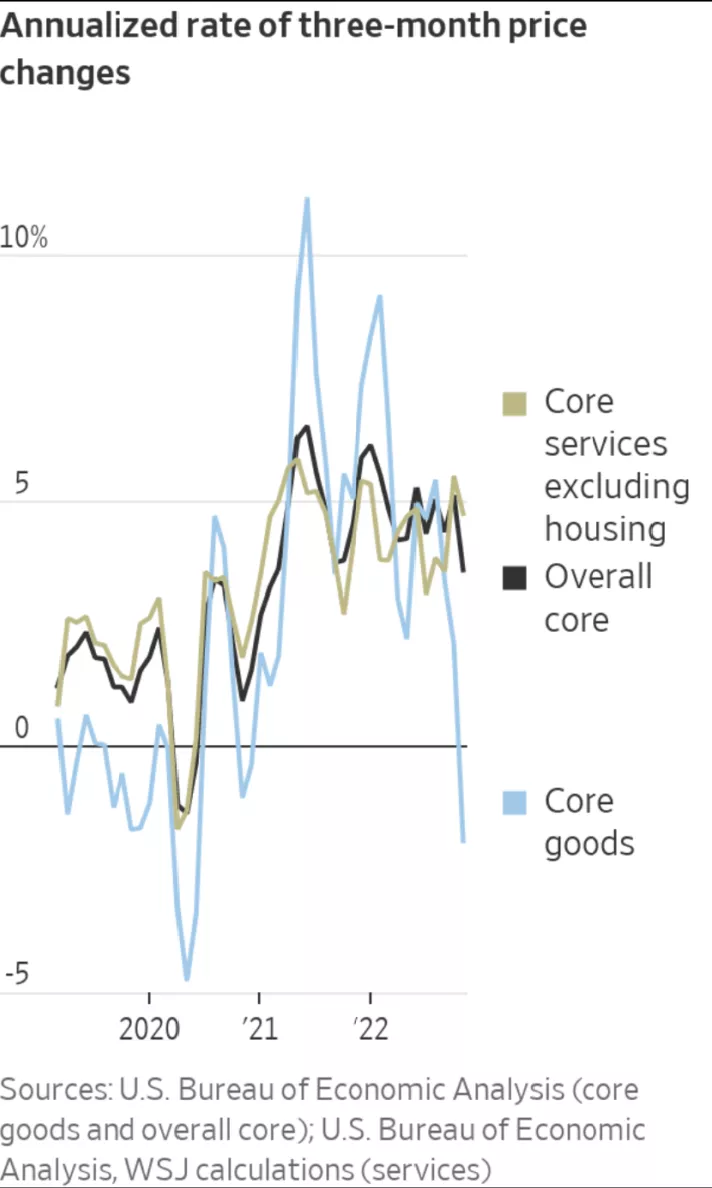
Core inflation itself is divided into goods and services inflation. And while goods inflation is rolling over, services inflation is staying stubbornly high – supposedly because of the hot jobs market. Core goods inflation was -0.5% in November while core services inflation was 0.4%. You can also see the divergence between goods and services inflation in the chart at the top of this blog – though that graph depends on different inflation data than the CPI.
But even core services inflation isn’t pure enough for some wonks. They want to strip out other prices as well like housing, medical care and/or transportation. I’m not sure what’s left after you strip all these prices out but suffice it to say that tomorrow morning some wonks will insist on focusing on core services inflation excluding shelter."
While we look for good news and silver linings in the upcoming CPI release contributor Dan Ashmore reports the World Bank Warns Of Global Recession As Growth Forecasts Cut For 2023.

"Just when the markets were beginning to feel a little more optimistic, a reminder of the predicament facing the world arrived. The World Bank cut its growth forecasts Tuesday, painting a grim picture of the year ahead for many nations.
Global recession in the cards
The World Bank expects global GDP growth of 1.7% in 2023. Outside of 2009, which was the aftermath of the Great Financial Crash, and the COVID-inspired 2020, it is the lowest rate since 1993. You don’t need me to tell you that that is…not good.
Even more startling is the fact that the 1.7% forecast came not too long after its last report in June 2022, when the bank forecasted global growth for 2023 to land at 3%.
Given fragile economic conditions, any new adverse development — such as higher-than-expected inflation, abrupt rises in interest rates to contain it, a resurgence of the COVID-19 pandemic or escalating geopolitical tensions — could push the global economy into recession
World Bank
And so, the “R” word is firmly in the lexicon for nations around the globe. This is the dilemma that faces central banks across the globe, of course. Interest rate hikes are needed in order to rein in rampant inflation, but hike too far and a recession will be triggered...
Which countries are forecast to grow at what rates?
Growth in the US is forecast to come in at 0.5%, while the eurozone is predicted to be flat. “Growth in advanced economies is projected to slow down from 2.5% in 2022 to 0.5% in 2023. Over the past two decades, slowdowns of this scale have foreshadowed a global recession”, the World Bank added.
The pain is anticipated to be worse for the emerging economies, many of which are saddled with high debt burdens and hence extra vulnerable to the rising interest rate environment. Their conditions are worsened by “compounded by high inflation, currency depreciation, tighter financing conditions, and other domestic headwinds”
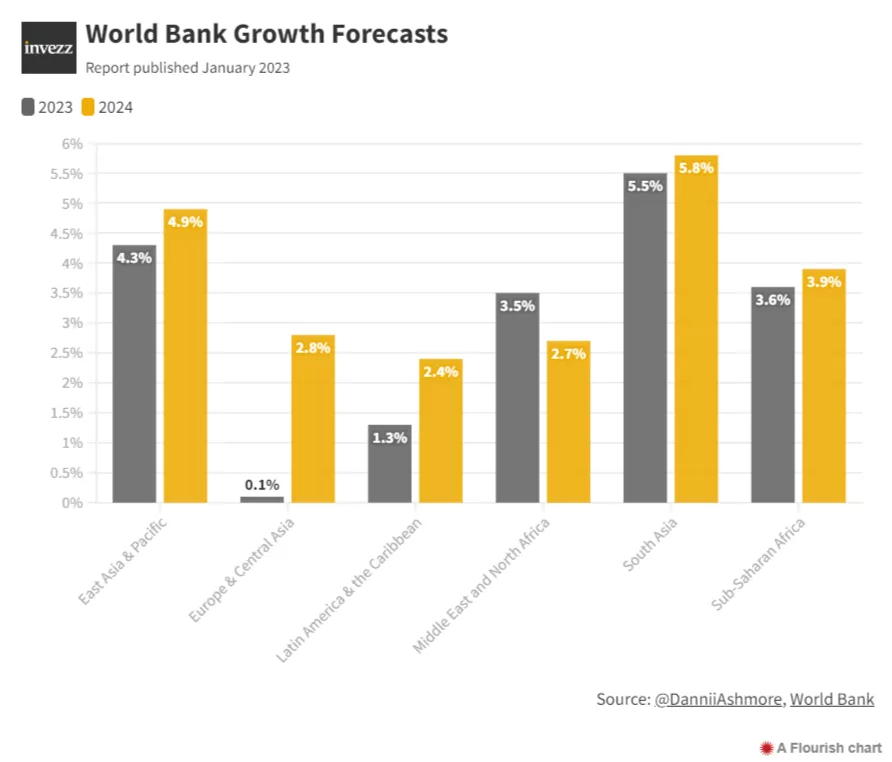
The forecasted growth of 0.5% in the US in 2023 is 1.9 percentage points below previous forecasts and would be the weakest performance outside of official recessions since 1970. This will no doubt be weighing on the minds of policymakers in the Fed.
In Europe, the eurozone got a downward adjustment of 1.9% to arrive at the 0% rate, while China has projected growth of 4.3% this year – 0.9% below previous forecasts, despite the economy opening up over the past few weeks following a long period of COVID lockdowns.
Closing out today's column TalkMarkets contributor Joseph Calhoun offers readers an opportunity to enhance their financial education with a primer on Large Cap Equity.
"Let’s take a look at the trends in Large Capitalization Equity. We are global investors so we’ll look at international too but the US is the biggest economy and market in the world so that’s where we’ll start.
First of all, let’s define Large Capitalization Equity. The common definition of large, mid and small cap is:
Large Cap = >$10 billion
Mid Cap = $2 – $10 Billion
Small Cap = $200 Million – $2 Billion
That may be the “official” definition but the indexes themselves show more range. The market cap of the companies in the S&P 500, the best known large cap index, range from $5.2 billion (Lincoln National) to $2.1 trillion (Apple). The S&P 400 (Mid Cap) ranges from $1.75 billion (Pebblebrook Hotel Trust) to $14.5 billion (Fair Isaac). The S&P 600 ranges from $155 million (Bed, Bath & Beyond) to $6.3 billion (Agree Realty). There are other indexes for each market cap as well such as the Russell 1000 for large cap or the Russell 2000 for small cap.
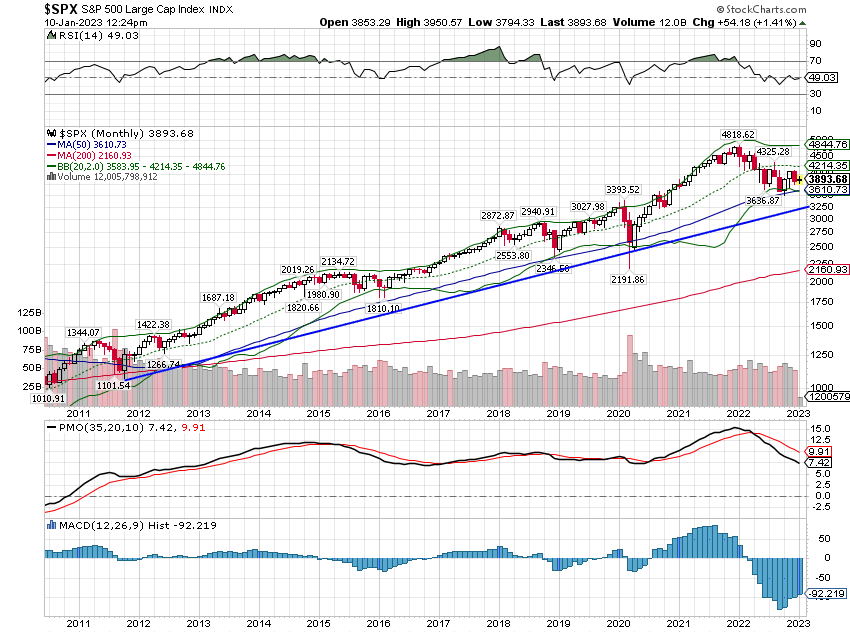
S&P 500
I’ve drawn in some trend lines but don’t take them as any kind of formal technical analysis. We’re just looking at general trends. In this case, for the S&P 500, the short term trend is obviously down while the intermediate term trend is up but fairly weak. Total returns over the last 6 month, 1 year and 3 years are 0.68%, -15.4% and 24.8% respectively.
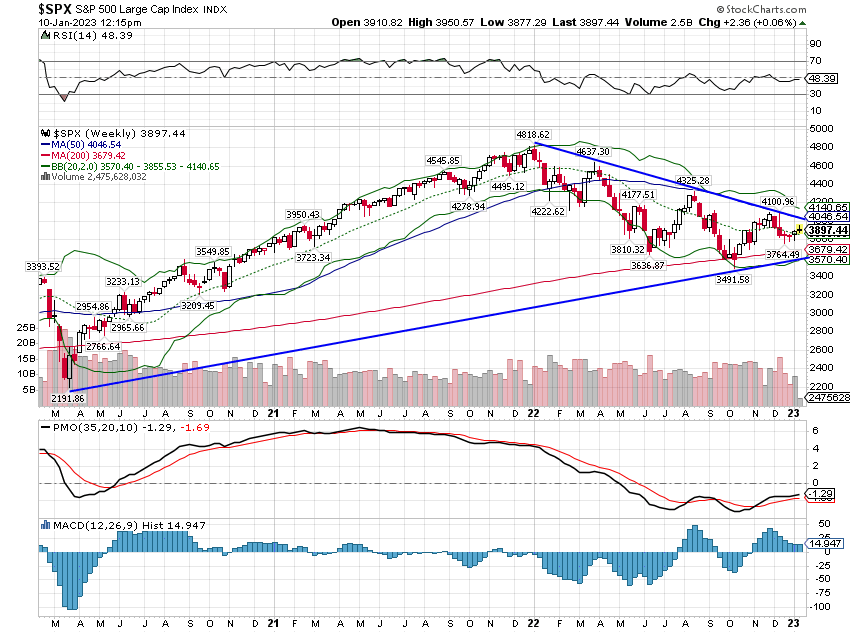
The long term trend is also pretty obvious. The 10 year return is 223.1%. By the way, this is a log scale chart which is how you should view these very long term charts. One other thing to notice here is that returns from stocks are pretty lumpy. You go through fairly long periods – or at least they seem long when you are going through them – where you just don’t make much. The last two years the S&P 500 is up just 4.9% total. From March 2018 to March 2020 the index was up 1.9%. From June 2014 to February 2016 it rose just 4.2%. The gains tend to be concentrated and persistent; the uptrends rarely give you a significant dip to buy. If you have long term goals you probably need to use the flat to down periods to accumulate. The peak in late 2021 was an obvious place to raise cash as the index was well above the long term trend but that was an exception. You don’t often see indexes that far above the long term trend.
EAFE
Next, let’s take a look at an international, non-US, large cap index, the EAFE (Europe, Australasia, Far East). It has 796 constituents that range from $1.4 billion to $318.5 billion in market cap. Contrary to the S&P 500 I’d put the EAFE short term trend at neutral; it has already broken from its previous short term downtrend. The intermediate term trend is up but, like the S&P, fairly weak. 6 month, 1 year and 3 year returns are 11.0%, -9.9% and 8.73% respectively.
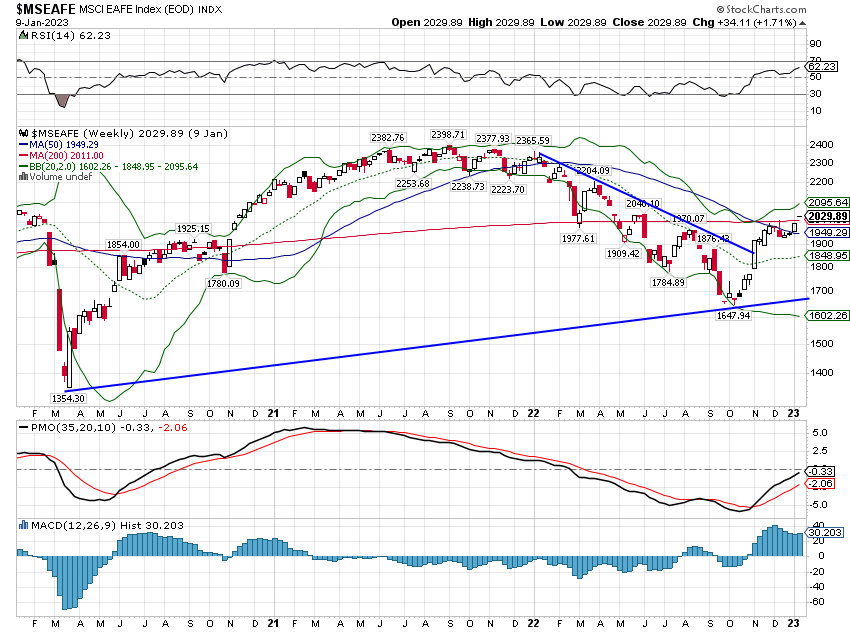
The long term trend is up but international stocks have vastly underperformed US stocks over the last decade. That is not surprising in a strong dollar environment. The 10 year return for the index is 69.9%."
There is more where this comes from in the full article, but to summarize let's jump to Calhoun's key takeaways:
-
US Large Cap stocks are still in a short term downtrend but the long term uptrend is intact.
-
International Large Cap stocks (EAFE) have broken their short term downtrend. Intermediate and long term trends are higher but the long term returns have not been attractive.
-
International Large Cap stocks are in a short term uptrend versus US LC. The trend has been driven by the falling dollar.
-
The long term trend still favors the US over International. Changing that trend will likely require a sustained downtrend in the dollar.
-
US Large Cap value is in a short term uptrend versus growth. The intermediate term trend is neutral and the long term trend still favors growth over value.
-
International Large Cap value is in a short term uptrend versus growth but the intermediate trend is neutral while the long term trend still favors growth.
-
International value has outperformed US over the very short term but the longer term trends continue to favor the US.
"Value and international are both outperforming right now and you have to stay with those short term trends to see if they become intermediate or long term trends. But investors should keep in mind that stocks are not all that cheap. US value stocks, if measured via the S&P 500 value index, are not cheap at all considering their expected growth of revenue and earnings. We continue to favor purchasing the individual equity of high quality issuers over the index approach. Globally there are plenty of good companies trading at cheap multiples and you don’t have to buy the expensive ones."
As always, caveat emptor.
Here's to a gliding downwards CPI reading.

Have a good one.
More By This Author:
Monday Musings: Indicators and Anticipation
Thoughts For Thursday: Will 2022 End With A Bang, And If So, What Kind?
Tuesday Talk: Continuing Yuletide Cheer?


Comments
Log in or sign up to join the conversation.