
Not only is there variations across surveys of different groups, there are variations across groups within households.
(Click on image to enlarge)
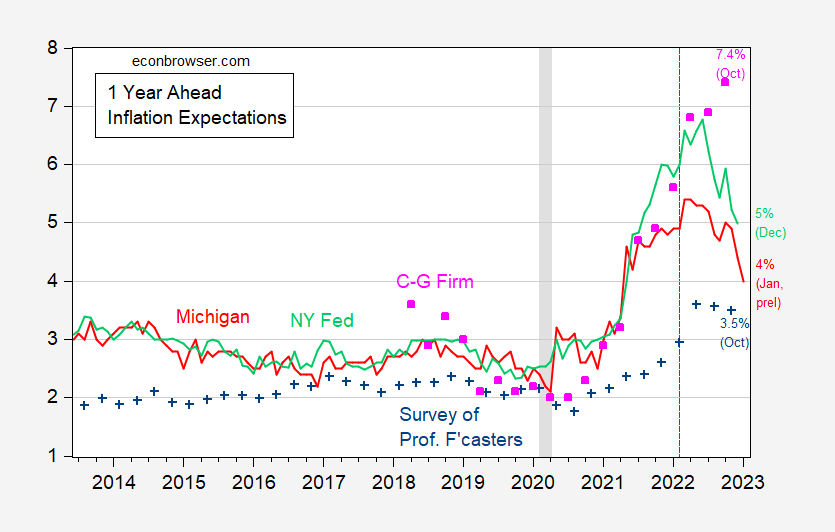
Figure 1: One year ahead CPI inflation median expected from Survey of Professional Forecasters (blue +), median expected from Michigan Survey of Consumers FINAL (red), median from NY Fed Survey of Consumer Expectations (light green), mean from Coibion-Gorodnichenko firm expectations survey [light blue squares], all in %. Michigan January inflation expectations prelminary. NBER defined peak-to-trough recession dates shaded gray. Red dashed line at expanded Russian invasion of Ukraine. Source: University of Michigan via FRED and Philadelphia Fed Survey of Professional Forecasters, NY Fed, and Coibion and Gorodnichenko, and NBER.
As noted before, expectations drawn from surveys of consumers and households are typically above those drawn for survey of economists. Of late, firm expectations are above households.
Variations between households and firms are discussed in detail in the excellent survey by Weber, D’acunto, Gorodnichenko and Coibion (JEP, 2022). Here’re some pictures of the variation across households, by income, and by education. Because it’s hard to see the variation across the entire sample, I present the data available from the 2013M06-2022M12 broken up into pre-pandemic, and pandemic periods.
(Click on image to enlarge)
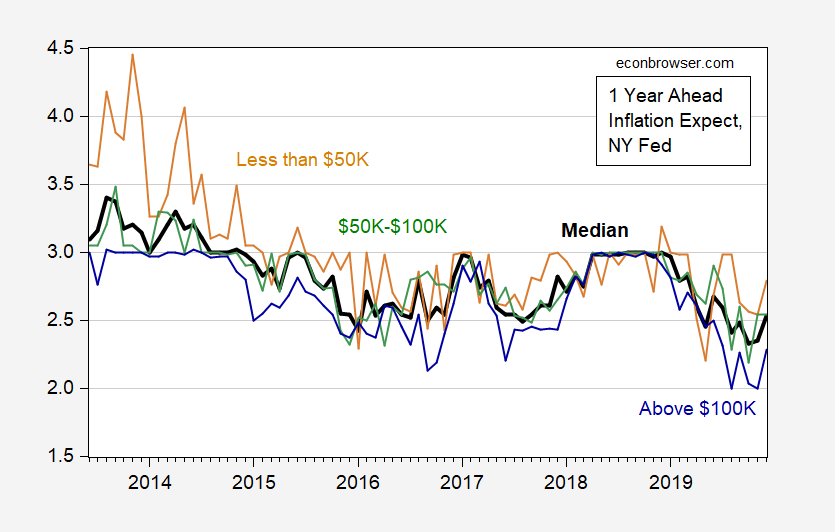
Figure 1: One year ahead expected CPI inflation median (bold black), for HH income below $50K (tan), between $50K-$100K (green), over $100K (blue), 2013M06-19M12. Source: NY Fed.
(Click on image to enlarge)
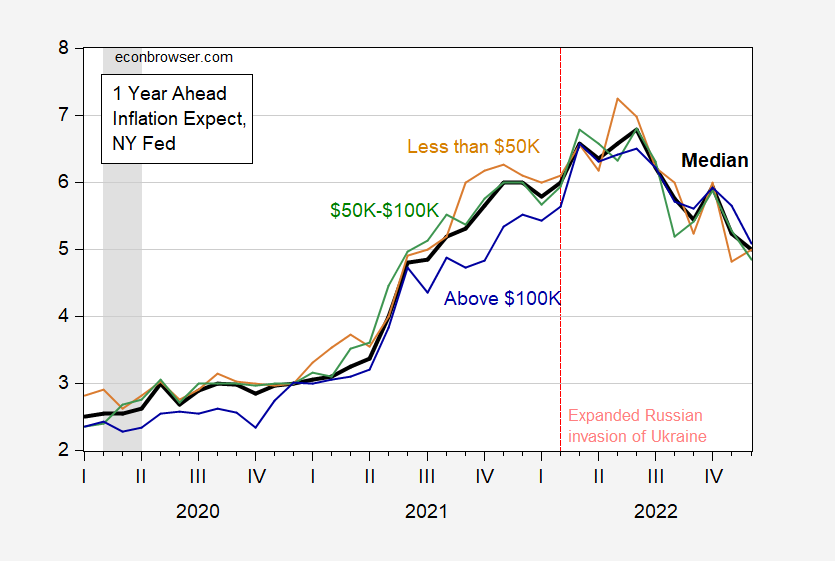
Figure 2: One year ahead expected CPI inflation median (bold black), for HH income below $50K (tan), between $50K-$100K (green), over $100K (blue), 2019M01-2022M12. NBER defined peak-to-trough recession dates shaded gray. Source: NY Fed, NBER.
(Click on image to enlarge)
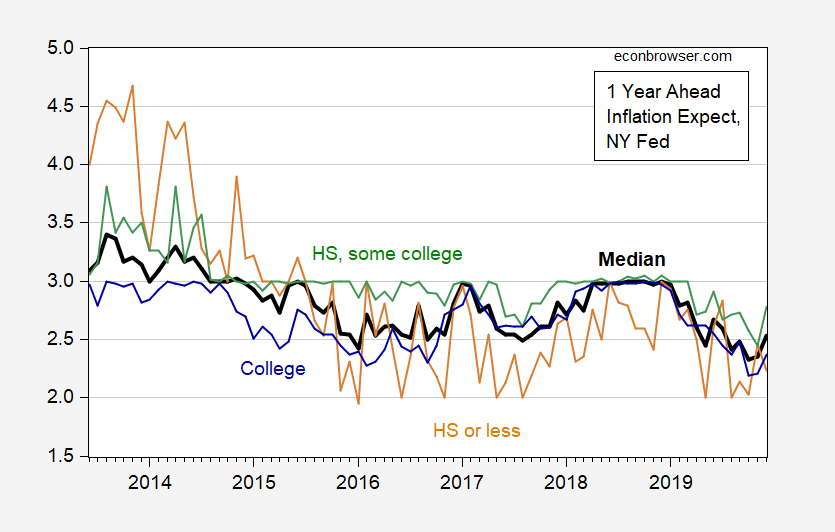
Figure 3: One year ahead expected CPI inflation median (bold black), for High School or less (tan), High School and Some College (green), BA or Higher (blue), 2013M01-2022M12. NBER defined peak-to-trough recession dates shaded gray. Source: NY Fed, NBER.
(Click on image to enlarge)
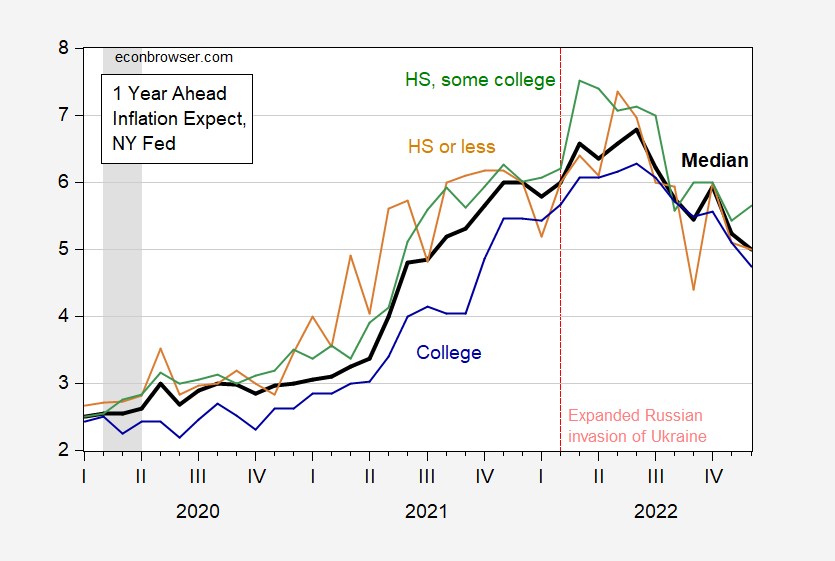
Figure 4: One year ahead expected CPI inflation median (bold black), for High School or less (tan), High School and Some College (green), BA or Higher (blue), 2019M01-2022M12. NBER defined peak-to-trough recession dates shaded gray. Source: NY Fed, NBER.
Bottom line for forecasts by income groups — those with lower incomes tend to have higher forecasts of inflation. That’s true over the pre-pandemic period as well as after. The higher forecasted inflation rates might be due to the higher inflation rates experienced by these groups (that is higher expected inflation is associated with higher currently experienced inflation). Recall, the CPI is plutocratic, that is it represents the consumption bundle of a household at the roughly 70th percentile. It must be noted, thought, that on average, household expectations have been more upwardly biased than those from surveys of professional forecasters.
For educational achievement levels, it appears the degree of bias with respect to median expectations depends on the time period. For instance, high school or less respondents reported higher expectations in 2013-14, and again in 2021 and mid-2022. These are exactly times of upward movements in gasoline prices. In other words, these household weigh more gasoline prices than households with lower levels of educational achievement.
As for firms, Weber et al. (2022) note:
Observed price signals influence aggregate inflation expectations not just of households, but also of firm managers, who focus on the price signals that they observe in their industries. For example, firms in sectors that have witnessed higher inflation recently tend to form higher beliefs about aggregate inflation, even when those industry-level price changes are unrelated to aggregate price changes (Andrade et al. forthcoming). The importance of directly observed price changes as an individual-level signal that helps to explain aggregate inflation expectations is a pervasive finding in the literature.
More By This Author:
More On An Inflation Regime SwitchDecember 2022 CPI
CPI Headline, Core Inflation Nowcasts And Forecasts


Comments
Log in or sign up to join the conversation.