
Here are the levels of headline and core CPI, versus forecasts and nowcasts.
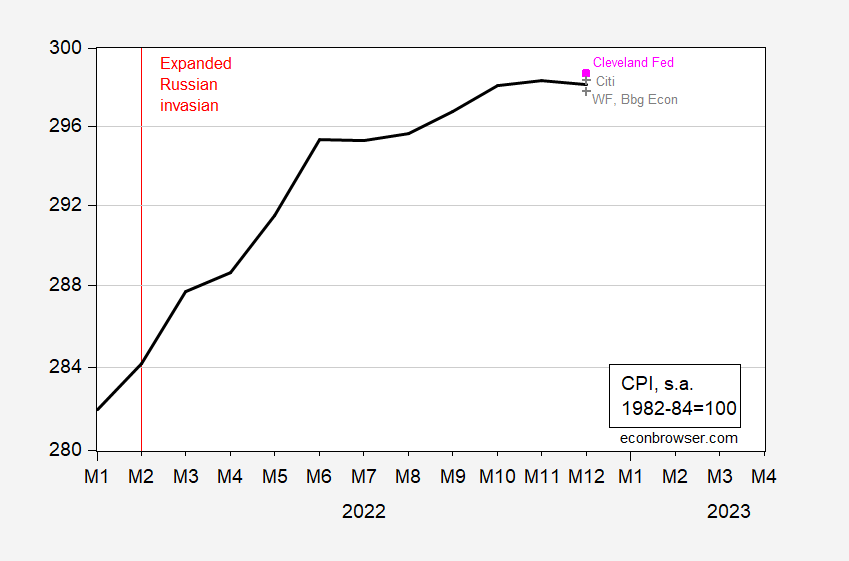
Figure 1: CPI level, 1982-84=100 (black), Cleveland Fed nowcast as of 1/11/2023 (pink square), high and low forecasts (gray +). Source: BLS via FRED, Cleveland Fed, Bloomberg (1/11/23), author’s calculations.
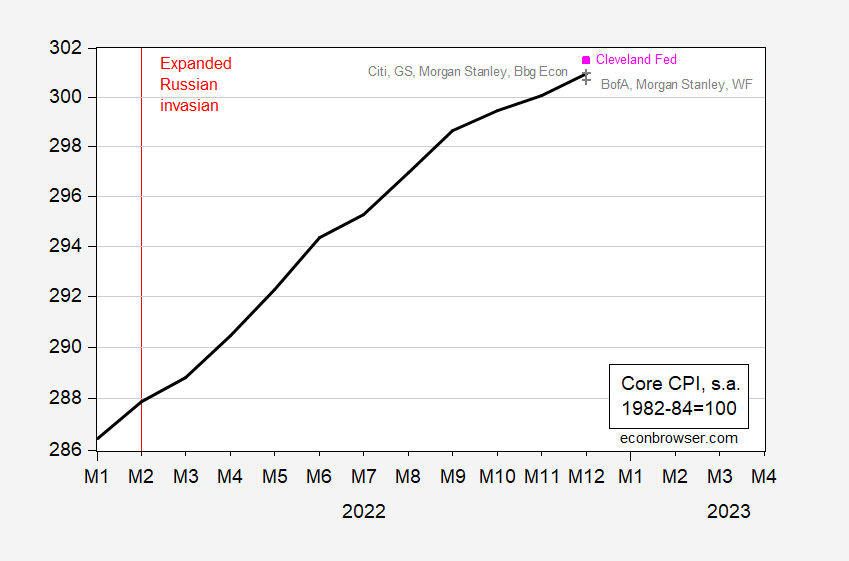
Figure 2: Core CPI level, 1982-84=100 (black), Cleveland Fed nowcast as of 1/11/2023 (pink square), high and low forecasts (gray +). Source: BLS via FRED, Cleveland Fed, Bloomberg (1/11/23), author’s calculations.
What does this mean for core inflation? In Figure 3 I plot the actual and implied inflation rates.
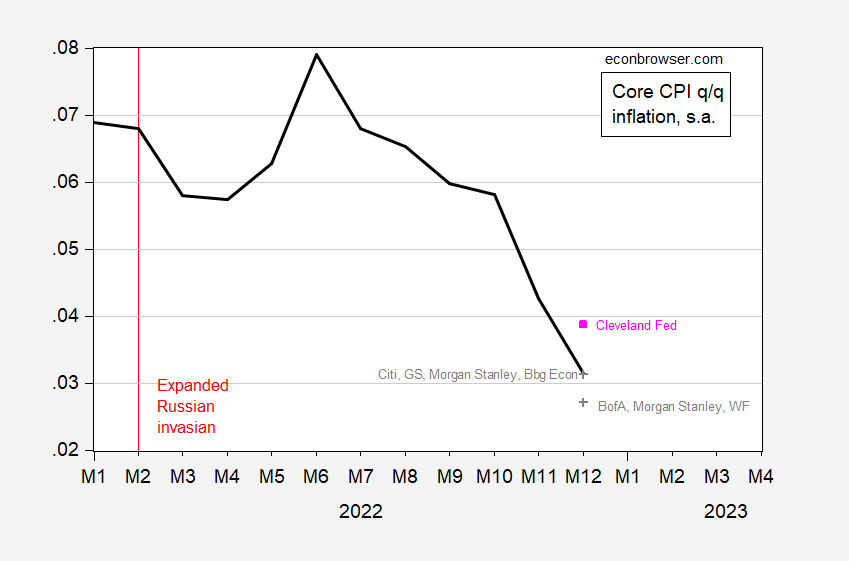
Figure 3: Quarter-on-quarter core CPI inflation rate, annualized (black), Cleveland Fed nowcast as of 1/11/2023 (pink square), high and low forecasts (gray +). Source: BLS via FRED, Cleveland Fed, Bloomberg (1/11/23), author’s calculations.
Actual q/q core inflation undershot the Cleveland Fed’s nowcast. In Figure 4, I show CPI vs. PCE q/q core inflation.
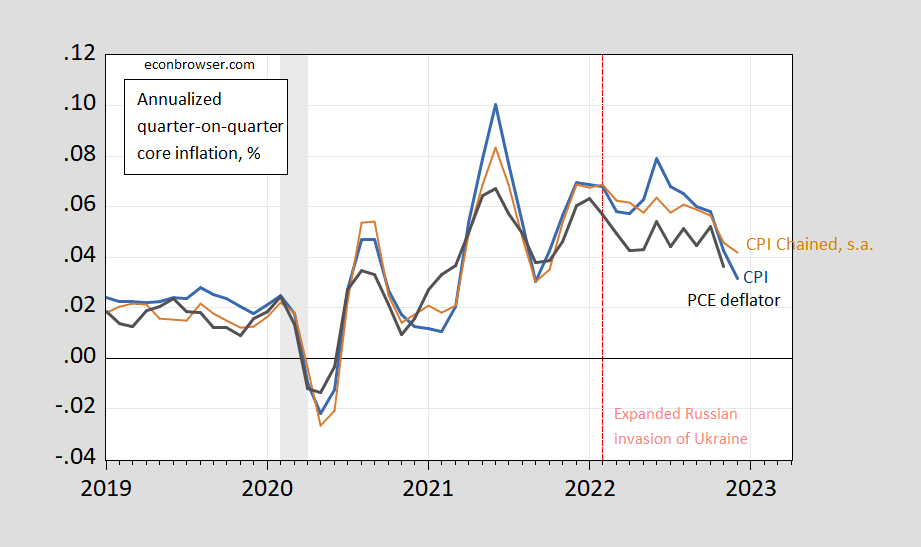
Figure 4: Quarter-on-quarter inflation of core CPI (blue), chained core CPI (brown), personal consumption expenditure core deflator inflation (black), all in decimal form (i.e., 0.05 means 5%).Chained CPI seasonally adjusted using geometric Census X13 (brown). NBER defined recession dates (peak-to-trough) shaded gray. Source: BLS, BEA, NBER, and author’s calculations.
This development seems to support the idea of a switch in the inflation regime (see this post). Although m/m CPI inflation rose, the Cleveland Fed’s nowcast for core PCE in December was little changed in response to the CPI release, and now stands at 0.32 ppts m/m.
More By This Author:
CPI Headline, Core Inflation Nowcasts And ForecastsNowcasts As Of January 10
How Far Off Is the Establishment Survey Nonfarm Payroll Employment Series?


Comments
Log in or sign up to join the conversation.