
From Popina, McCormick, and Beyoud, “Traders lose trust…” in Bloomberg today:
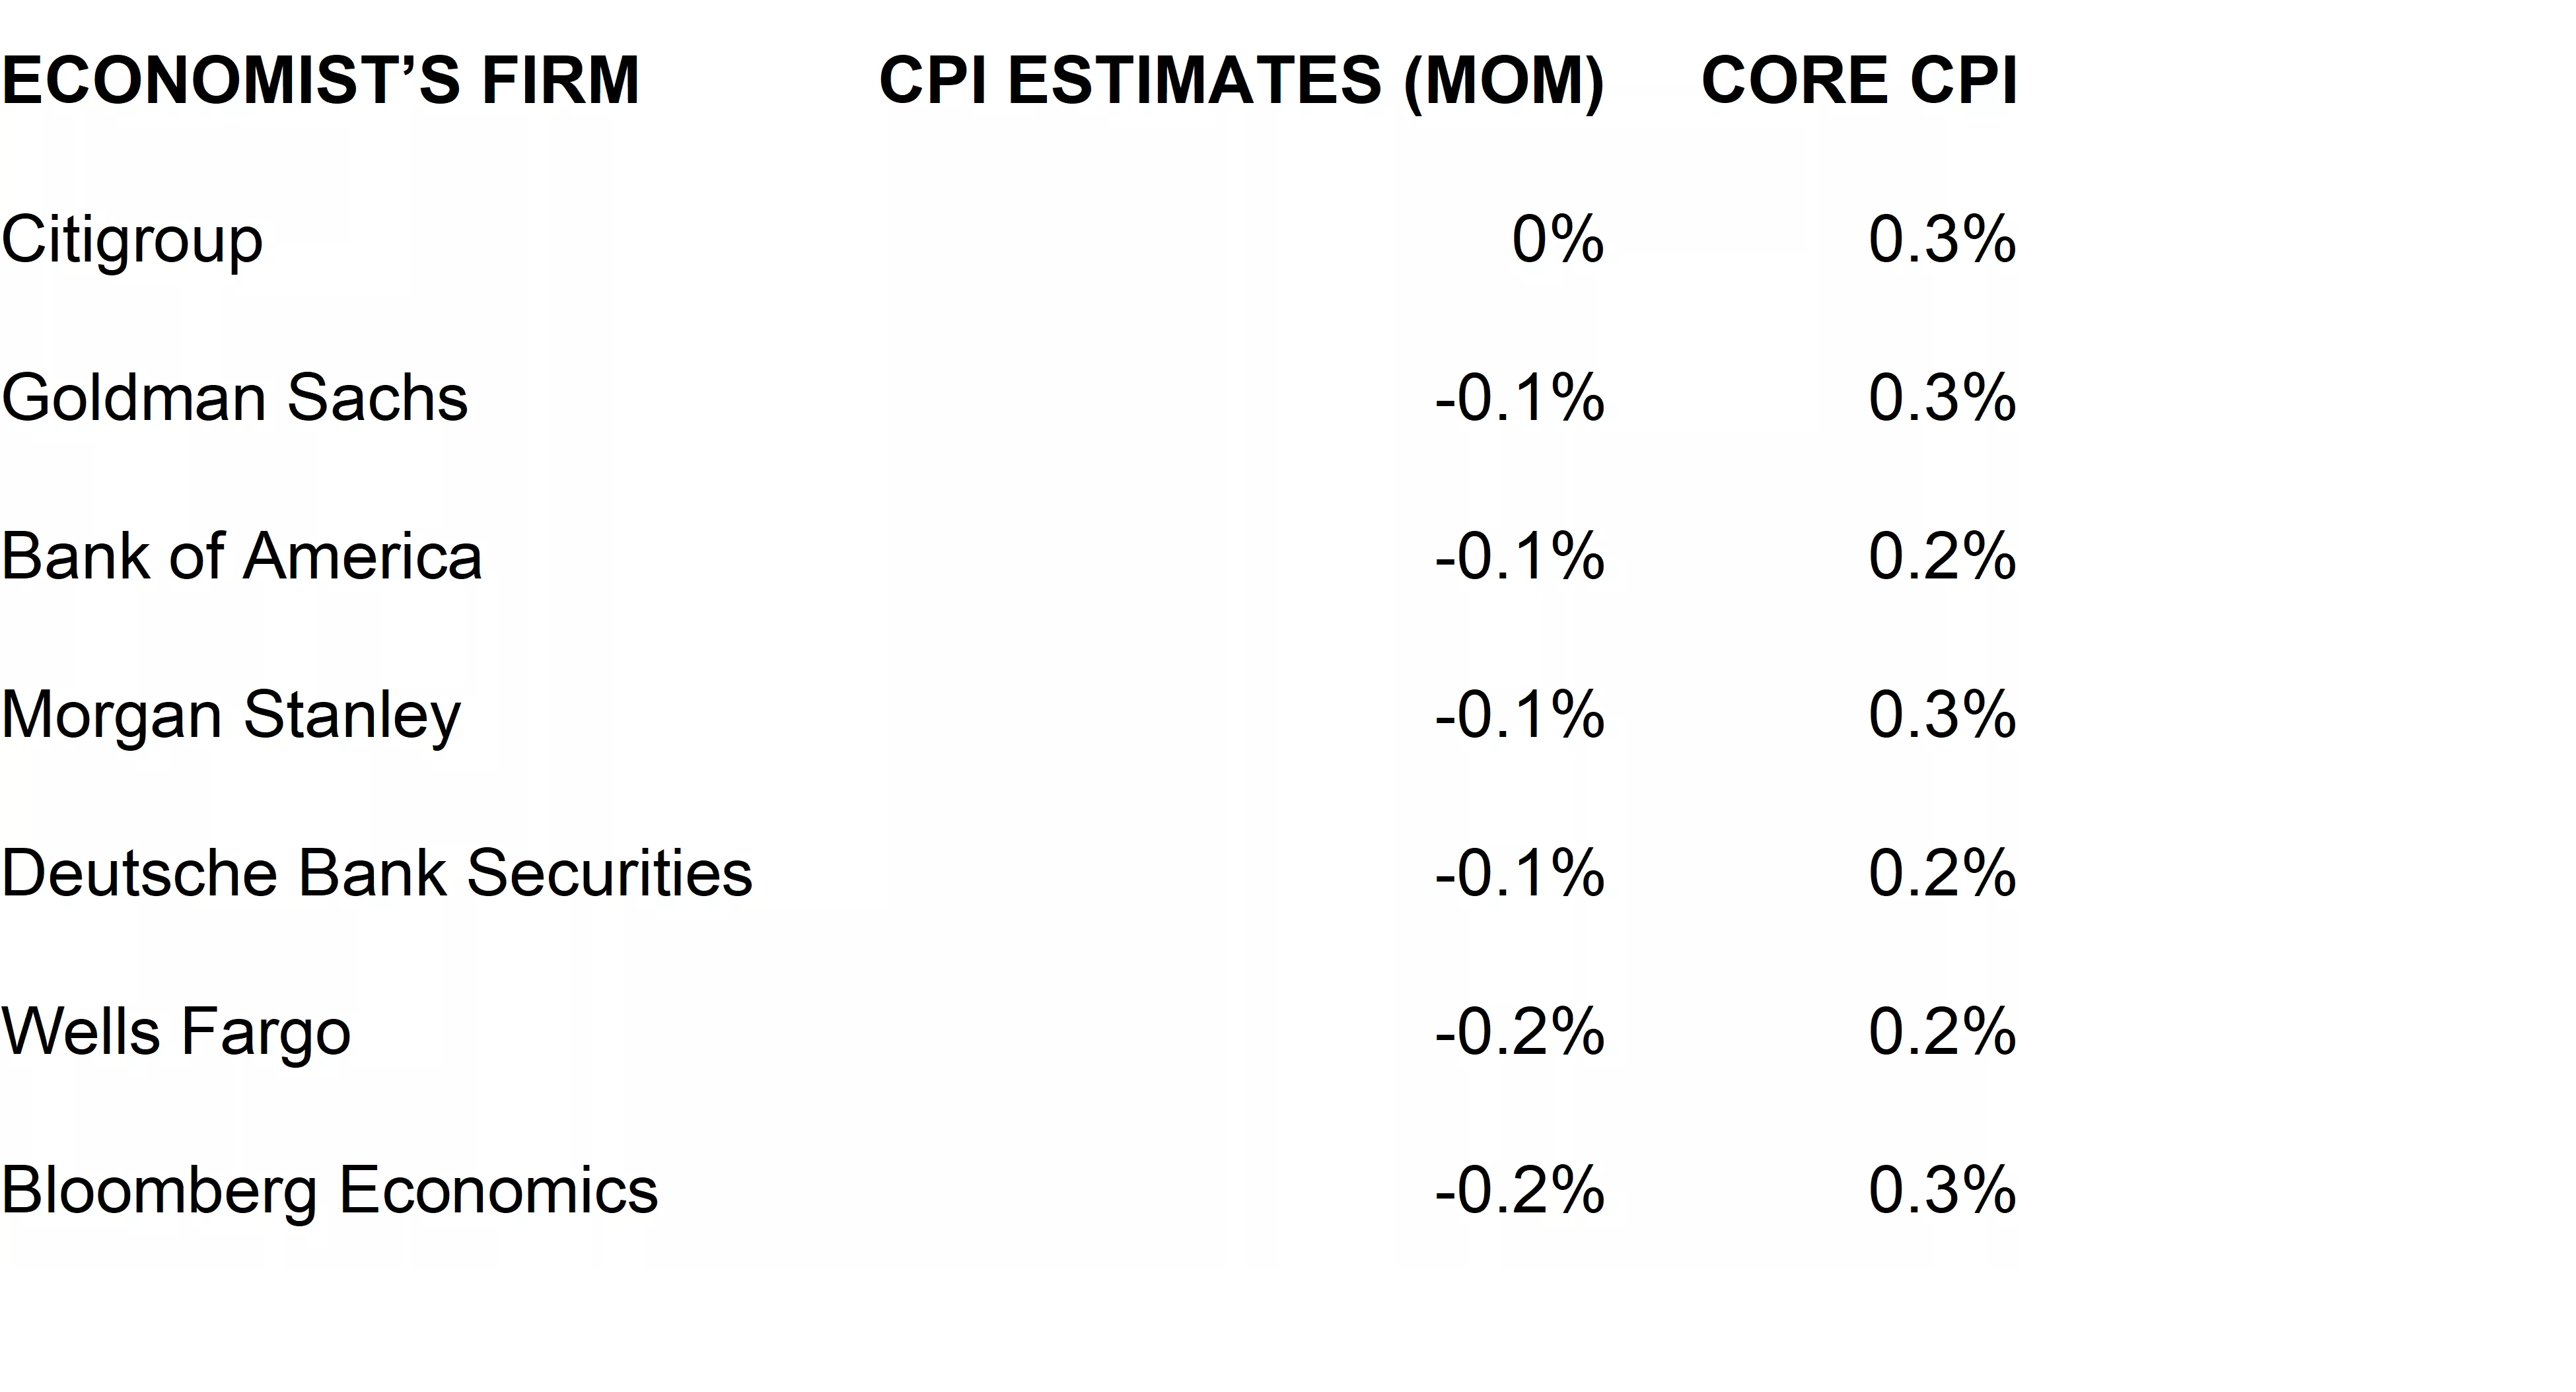
Source: Popina et al., Bloomberg, 11 January 2023.
I thought it of interest to compare against the Cleveland Fed’s nowcast. Here are the levels of headline and core CPI.
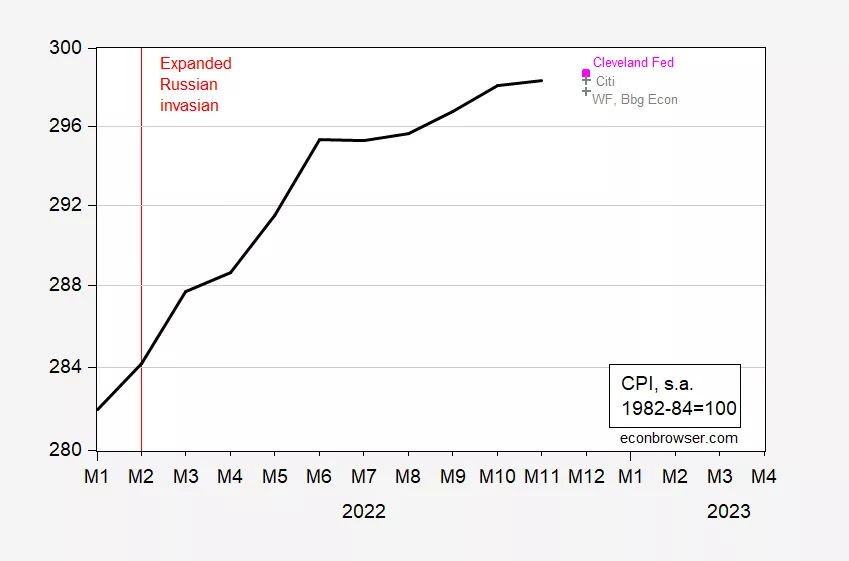
Figure 1: CPI level, 1982-84=100 (black), Cleveland Fed nowcast as of 1/11/2023 (pink square), high and low forecasts (gray +). Source: BLS via FRED, Cleveland Fed, Bloomberg (1/11/23), author’s calculations.
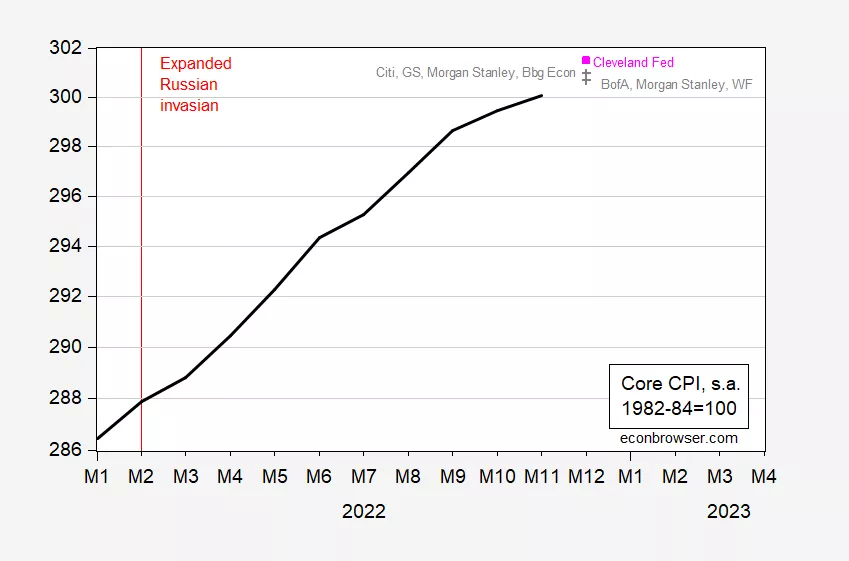
Figure 2: Core CPI level, 1982-84=100 (black), Cleveland Fed nowcast as of 1/11/2023 (pink square), high and low forecasts (gray +). Source: BLS via FRED, Cleveland Fed, Bloomberg (1/11/23), author’s calculations.
What does this mean for core inflation? In Figure 3 I plot the actual and implied inflation rates.
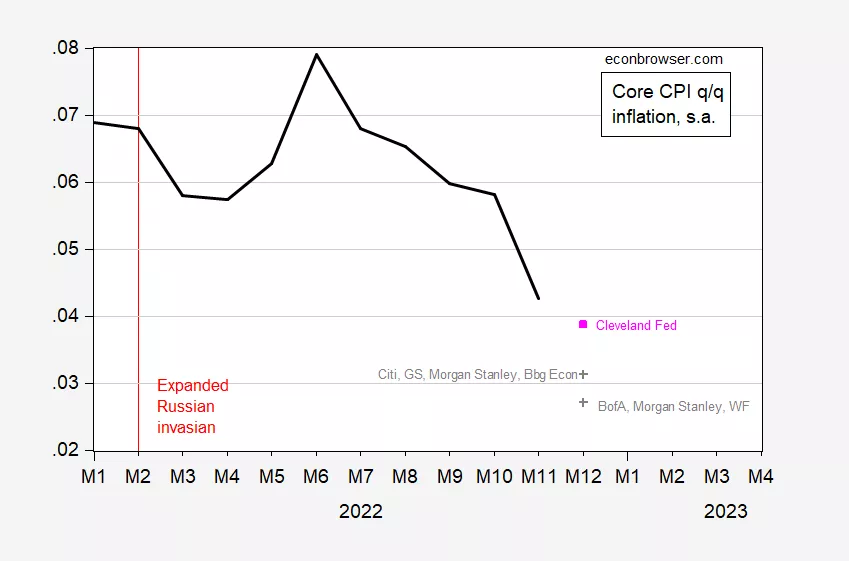
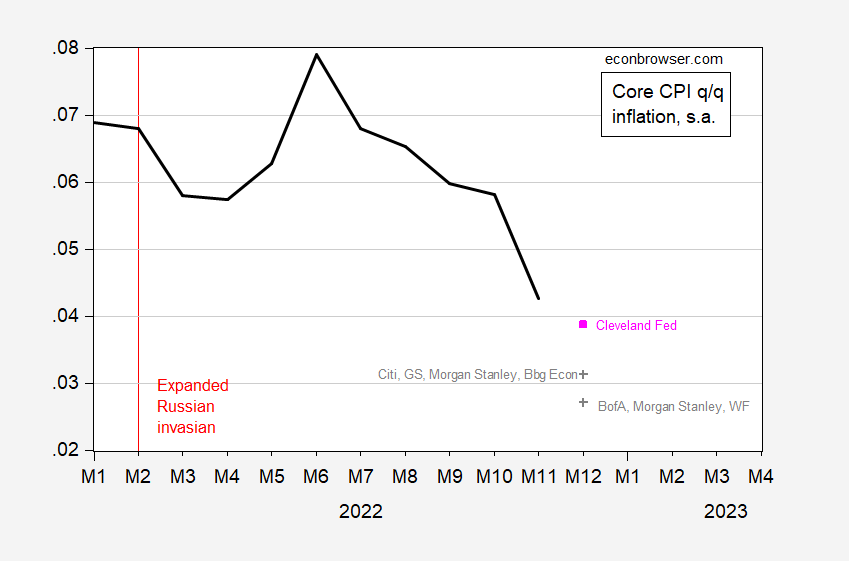
Figure 3: Quarter-on-quarter core CPI inflation rate, annualized (black), Cleveland Fed nowcast as of 1/11/2023 (pink square), high and low forecasts (gray +). Source: BLS via FRED, Cleveland Fed, Bloomberg (1/11/23), author’s calculations.
Even with the high estimate of the Cleveland Fed’s nowcast, core inflation is decreasing on a q/q basis.
More By This Author:
Nowcasts As Of January 10
How Far Off Is the Establishment Survey Nonfarm Payroll Employment Series?
The Jobs Worker Gap In November


Comments
Log in or sign up to join the conversation.