
Late to the commentary, here’s a picture of the jobs-workers gap for November, based on JOLTS data:
(Click on image to enlarge)
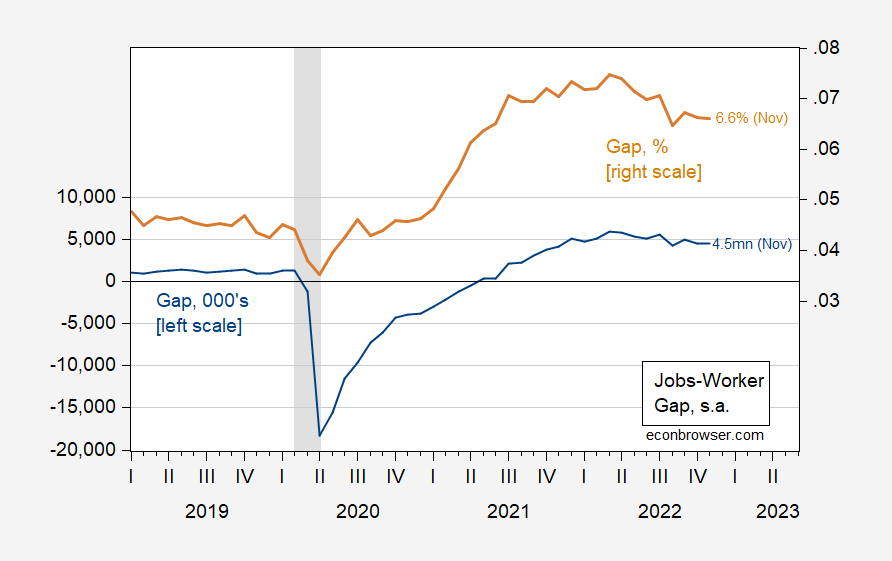
Figure 1: Jobs-worker gap, 000’s, s.a. (blue, left scale), and gap, %, s.a. (tan, right scale). NBER defined peak-to-trough recession dates shaded gray. Source: BLS JOLTS data via FRED, NBER, and author’s calculations.
Note that the gap remains large, so the labor market remains tight (and in fact, the gap was at a maximum in 2022H1). To see this further, layoff rates are still far from hiring rates.
(Click on image to enlarge)

Figure 2: Hirings to nonfarm payroll employment (blue), and hiring to nonfarm payroll employment. (tan). NBER defined peak-to-trough recession dates shaded gray. Source: BLS JOLTS data via FRED,and author’s calculations.
The quit rate actually rose in November. From my view, the labor market remains pretty tight, and I observed that on Marketplace on Monday.
Are we in recession as of November? We can use the Job Workers Gap Business Cycle Indicator suggested by Paweł Skrzypczyński in this post, which equals the difference between the current gap and the maximum gap over the last 12 months. The value for 2022M11 is -0.89, still above the threshold value of -0.93 — but it is coming closer over time (it actually breached the threshold, as I have calculated it, in August before popping above the threshold).
More By This Author:
ADP Release, And The Flat Employment Growth In Q2 ThesisCoincident Indicators Of Recession: VMT, Heavy Truck Sales, Sahm Rule
Business Cycle Indicators At 2023’s Beginning


Comments
Log in or sign up to join the conversation.