
Thoughts For Thursday: Springing Ahead...
While it may be too early to call an end to the bear market there are signs this week that the market has put the banking crisis behind it and is springing ahead somewhat bullishly.

Yesterday the S&P 500 closed at 4,028, up 57 points, the Dow closed at 32,718, up 323 points and the Nasdaq Composite closed at 11,926, up 210 points.
Most actives were led by Tesla, up 2.5% (TSLA), followed by Intel, up 7.6% (INTC), and First Republic Bank, up 5.6% (FRC).

Chart: The New York Times
In morning futures trading S&P market futures are up 18 points, Dow market futures are up 160 points, and Nasdaq 100 market futures are up 44 points. Major commodities are also, trading higher.

Chart: The New York Times
TM contributor Patrick Munnelly writing in his Daily Market Outlook - Thursday, March 30 posits that the "Nasdaq is on the cusp of a new bull market".
"...the Nasdaq is poised to close out the quarter with record returns pointing to the potential for a technical new bull market set to be confirmed, as the tech-heavy index is set to post 20%+ returns from its December lows...
The latest print for US Q4 GDP is expected to remain at 2.7% year over year. US weekly jobless claims are expected to remain at record lows, suggesting little in the way of loosening the US labor market. US investors will likely be sitting on the sidelines ahead of Friday’s PCE deflator, the much-touted preferred inflation gauge for the Federal Reserve."
Elsewhere Munelly notes, "Eurozone March inflation indications delivered via German and Spanish numbers ahead of the Eurozone flash estimate on Friday. Investors will be alert to signs of a retreat in headline inflation due mainly to energy prices. Germany’s harmonized inflation is expected to drop to 7.5% from 9.3%. Core inflation, however, is expected to remain stubbornly high."

Contributor J. Brumley says Wednesday Was Good, But Not Great.
"It's been a back-and-forth affair, but the bulls are turning the tide. Thanks to Wednesday's gain, most of the indices are mostly above key technical ceilings.
Not everything is quite as bullish as we wish it was though.
But, first things first. Take a look at the daily chart of the S&P 500. While it's been back and forth since its early March low, as of today the index is back above its 50-day moving average line (purple) at 4016. More notable is the fact that the index seemed to push up and off of its now-converged 20-day (blue) and 100-day (gray) moving average lines to make it happen. With that move, the S&P 500 is now above all of its key moving averages, and inching upward."
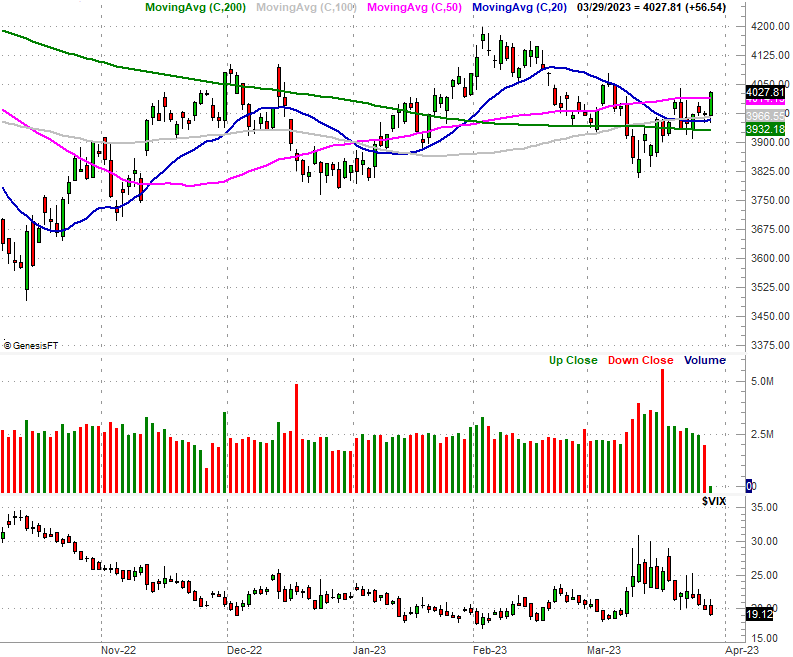
"The Dow Jones Industrial Average is also doing better than it was just a few days ago, fighting its way back above the 200-day moving average line (green) as well as its 20-day line (blue) today. But, where the blue chip index stopped its rally is suspicious. Wednesday's peak of 32,728 is right on line with a floor established beginning late last year (red, dashed), which first showed itself as a technical ceiling a week ago. Even if only for psychological reasons, there's something about this line in the sand that's too big too ignore...
As for the Nasdaq Composite, it's doing as well as it ever was, managing to log its best close in over a month today. It's also holding above all of its key moving average line, which means it's not likely to bump into serious resistance anytime soon...
The point is, while the action is encouraging, stocks aren't fully over the hump just yet. They're close though. Let's assume the current uptrend will remain in motion until we clearly can't afford to maintain that assumption any longer."
In an Editor's Choice piece, TalkMarkets contributor James Picerno anticipates Softer But-Still Resilient Growth Expected For US Q1 GDP.
"Despite warning signs flashing from several indicators, the US economy is expected to report moderate growth in next month’s “advance” GDP report for the first quarter, based on a set of nowcasts compiled by CapitalSpectator.com.
The median estimate for Q1 firmed up to a 1.7% gain in today’s update (seasonally adjusted annual rate). Although the projection marks a slowdown from the 2.7% increase reported for Q4, today’s revision suggests that the economy will continue to skirt a recession in the first three months of the year.
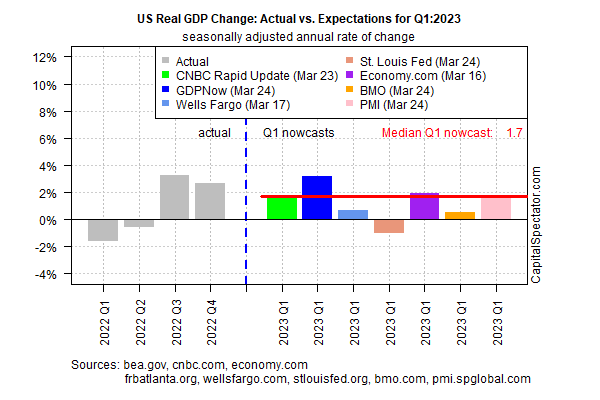
Notably, today’s revised median nowcast firmed up from the weak 0.5% estimate posted in the previous update on March.
Optimists will focus on the strongest nowcast in the chart above: the Atlanta Fed’s GDPNow model, which is projecting a 3.2% increase in Q1 output for the upcoming release on April 27. If correct, this estimate would mark an acceleration in output vs. last year’s final quarter.
Overall, today’s median nowcast suggests that the economy remains resilient after a year of relatively sharp, rapid interest-rate hikes by the Federal Reserve."
Contributor Chaim Siegel records Powell On Tape Today Saying To Expect One More Hike.
"Most of our measures are pointing bullish and have been for some time. We turned from bear last year to bull at the end of last year and there appears to be more building confirmation of a nice up move to come and more specifically in the 2nd half."

"It was reported on the tape at 1:46 PM EDT that "Powell In Meeting Indicated One More Interest Rate Hike This Year."
Also reported on the tape he apparently said in that same meeting, "Supply Chain Inflation Has Been Mostly Mitigated."
The fact that the supply chain has normalized means that main inflationary factor that the Fed blamed is now out of the way and no longer a driver to inflation.
Powell expecting one more hike is news and clarifies his change in language on the recent Fed day.
The recent Fed day the Fed press release had softer language saying, "some additional policy firming may be appropriate."
That was much softer than the previous Fed day saying, "ongoing [rate] increases."
Today, if reports are correct, that softer language means to Fed Chair Powell one more 25bp hike. That's new news."
See Elazar's article for additional notes and comments. Overall he says "The setup is bullish for markets."
Closing out the column today, in the "Where to Invest Department", TM contributor Sweta Killa suggests Quality ETFs To Buy For Market-Beating Returns Amid Turmoil.

"Wall Street has been struggling to find its solid footing owing to fears over financial instability and its contagion across the globe. Uncertainty about the Fed’s interest rate trajectory added to the woes. However, a series of recent data shows that the economy has been on the mend. This could provide an upward thrust to the stocks.
Against such a backdrop, investors should focus on high-quality investing. Quality stocks are rich in value characteristics with a healthy balance sheet, high return on capital, low volatility, elevated margins, and a track of stable or rising sales and earnings growth.
We have highlighted five ETFs targeting the niche strategy.
iShares MSCI USA Quality Factor ETF (QUAL)
With an AUM of $25 billion, iShares MSCI USA Quality Factor ETF provides exposure to large and mid-cap stocks exhibiting positive fundamentals (high return on equity, stable year-over-year earnings growth and low financial leverage) by tracking the MSCI USA Sector Neutral Quality Index. QUAL holds 124 stocks in its basket, with each making up not more than a 5.4% share.
iShares MSCI USA Quality Factor ETF charges 15 bps of annual fees and trades an average daily volume of 1.6 million shares.
Invesco S&P 500 Quality ETF (SPHQ)
Invesco S&P 500 Quality ETF tracks the S&P 500 Quality Index, a benchmark of S&P 500 stocks with the highest-quality score based on three fundamental measures, such as return on equity, accruals ratio and the financial leverage ratio.
Holding 101 stocks in its basket, Invesco S&P 500 Quality ETF amassed $4.4 billion in its asset base and trades at an average daily volume of 645,000 shares. SPHQ charges 15 bps in fees per year.
ALPS Barron's 400 ETF (BFOR)
With an AUM of $122.9 million, ALPS Barron's 400 ETF follows the Barron's 400 Index, offering investors exposure to the high-performing securities of U.S. companies. It uses MarketGrader's fundamental analysis to select stocks based on the strength of their fundamentals in growth, value, profitability and cash flow and then screens such components for specific criteria regarding concentration, market capitalization and liquidity.
ALPS Barron's 400 ETF holds 400 stocks in its basket, with none making up for more than 0.3% of assets. BFOR charges 65 bps as annual fees and trades a volume of 1,000 shares per day on average.
FlexShares Quality Dividend Index Fund (QDF)
FlexShares Quality Dividend Index Fund follows the Northern Trust Quality Dividend Index and maximizes exposure to quality and dividends, while maintaining a beta near 1. QDF is home to 139 stocks in its basket, with none making up for more than 9% of assets.
FlexShares Quality Dividend Index Fund accumulated $1.5 billion in its asset base and trades an average daily volume of 47,000 shares. QDF charges 37 bps as fees per year from investors.
SPDR MSCI USA StrategicFactors ETF (QUS)
SPDR MSCI USA StrategicFactors ETF offers exposure to stocks that combine low volatility, quality and value factor strategies. This is done by tracking the MSCI USA Factor Mix A-Series Capped Index. SPDR MSCI USA StrategicFactors ETF holds 627 stocks in its basket, with each accounting for less than 3.5% share.
SPDR MSCI USA StrategicFactors ETF attracted $919.2 million in its asset base and traded an average daily volume of 40,000 shares. QUS charges 15 bps of fees per year from investors."
See the full article for additional details.
Caveat Emptor, as always.
That's a wrap for today.
Have a good one.

Image: Rosana Schmitt
More By This Author:
Tuesday Talk: Walking It Back, Moving Forward
Thoughts For Thursday: Somewhere In Between


