Thoughts For Thursday: One Down, One To Go!
Of the two major issues of interest to the market in July one is in, the June CPI number and the second, a Fed decision on interest rates is just under two weeks away.

Inflation cooled to a 3% annual rate in June, a number which earned the Fed some much needed credit for pausing interest rate hikes in June to positive effect. Still, the FedWatch Tool is currently showing a 92.4% expectation that the Fed will raise rates by 25 bps at it's July 26, FOMC meeting, and a 7.6% expectation for a continued pause in rate hikes. It will be interesting to see how expectations change in the days leading up to the meeting as many analysts are already calling for a continued pause.
Overall, the markets reacted well to the June CPI data. At the close of trading on Wednesday the S&P 500 was up 33 points to close at 4,472, the Dow closed at 34,347, up 86 points and the Nasdaq Composite closed at 13,919, up 158 points.

Chart: The New York Times
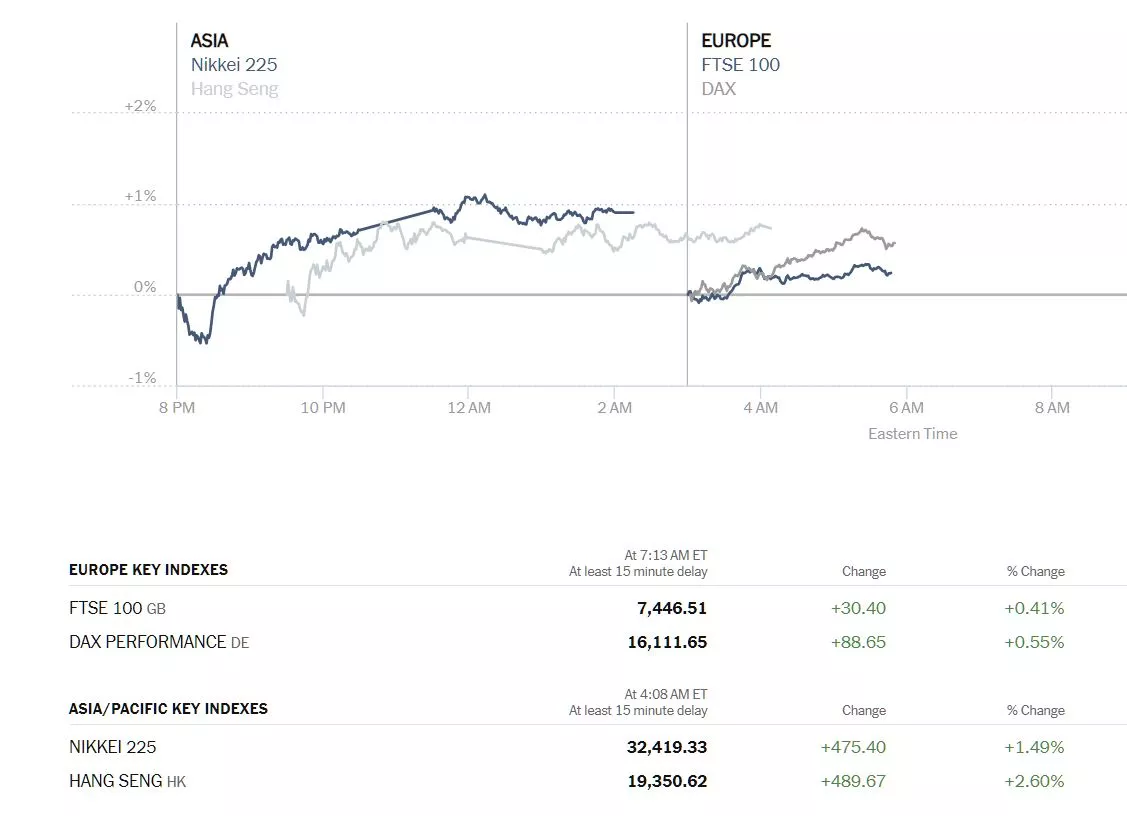
Global markets also reacted positively to the lower U.S. June inflation numbers. Asian markets closed higher and European markets are higher out of the gate this morning.

Chart: The New York Times
In morning futures trading, S&P 500 market futures are up 13 points, Dow market futures are up 47 points and Nasdaq 100 market futures are up 98 points.
TalkMarkets contributor and economist Menzie Chinn looks at Inflation And Core Inflation At Various Horizons.
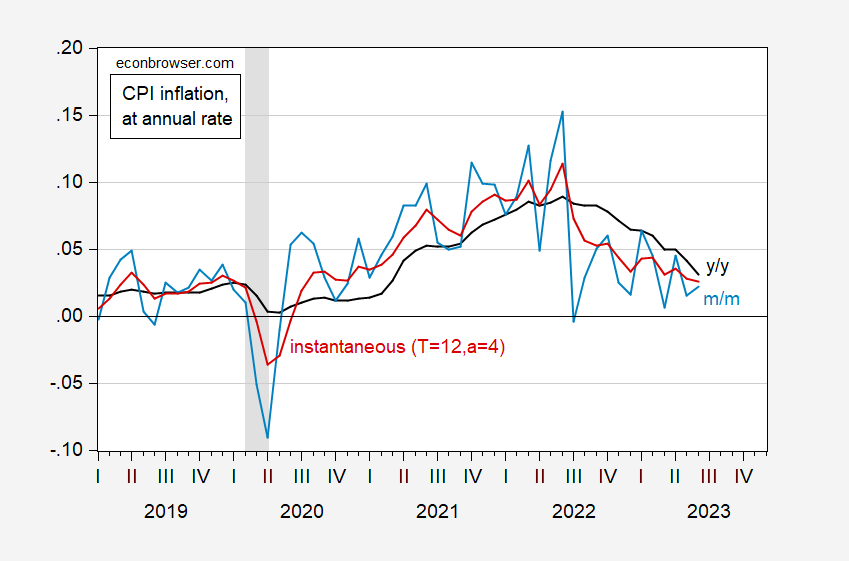
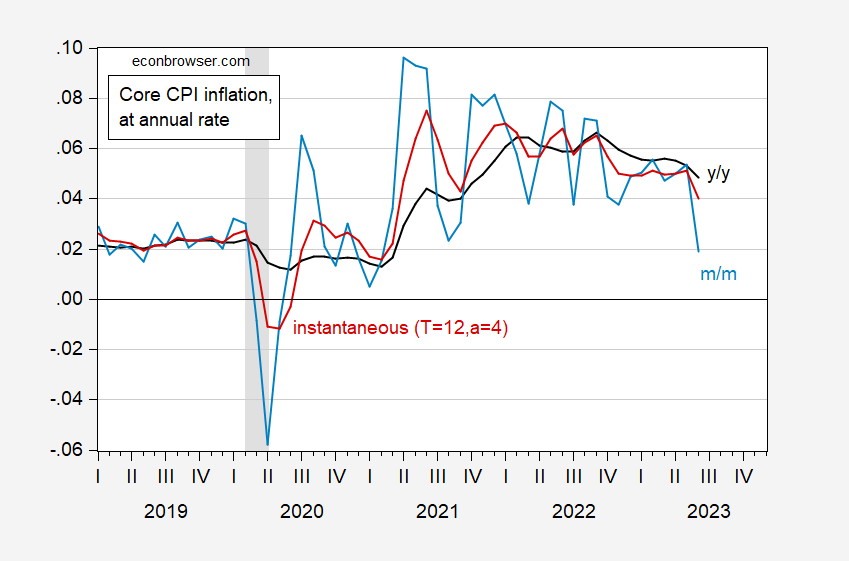
"Headline and core are both at 0.2% m/m, vs. Bloomberg consensus at 0.3%. Here’s picture of m/m, y/y, and instantaneous (Eeckhout 2023, T=12,a=4).

Figure 1: Year-on-year headline CPI inflation (black), month-on-month (light blue), and instantaneous (T=12, a=4) (red). NBER defined peak-to-trough recession dates shaded gray. Source: BLS, NBER, and author’s calculations.

Figure 2: Year-on-year core CPI inflation (black), month-on-month (light blue), and instantaneous (T=12, a=4) (red). NBER defined peak-to-trough recession dates shaded gray. Source: BLS, NBER, and author’s calculations.
So, short horizon movements are in the same direction as the year-on-year that are the focus of popular discussion. The trend as proxied by Eeckhout (2023)‘s measure of instantaneous inflation is the same (downward). Core m/m is 1.9% annualized, while it’s 4% using instantaneous.
For reference, here are the various price indices in levels.

Figure 3: CPI (black), core CPI (gray), PCE deflator (blue), core PCE deflator (light blue), and HICP (red), all in logs 2020M02=0. NBER defined peak-to-trough recession dates shaded gray. Source: BLS, BEA via FRED, NBER, and author’s calculations."
All pointing down, but enough to call it a trend?
In Europe contributor Bert Colijn writes Eurozone Industrial Production Confirms No Strong GDP Bounce Back For 2Q.
"With more data coming in, it really seems to be a coin flip as to whether the Eurozone technical recession continued into the second quarter...Industrial production increased by 0.2% in May, which is the second small increase in a row after plummeting in March. Overall, this leaves the level of activity well below the average for where it was in 2022, in line with a weakening global growth environment in which demand for goods has moderated."

"For GDP growth in the second quarter, the impact is clear. Production will have needed a strong rebound in June to have an average production level similar to the first quarter. That seems unrealistic given the negative PMI and industrial sentiment data for the month. Another quarterly decline in industrial output is therefore in the making, which is also likely for retail sales. The goods part of the economy is therefore likely to have remained in recession and services – on which we have much less intermediate data – will have needed to perform well to eke out a positive growth figure. It’s likely that the Eurozone economy has therefore continued to straddle the zero growth line in the second quarter, extending the current phase of stagnation in economic activity."
TM contributor Danielle Park gives her reading of Fed and Bank of Canada actions in Central Banks Holding The Hand Brake.
"
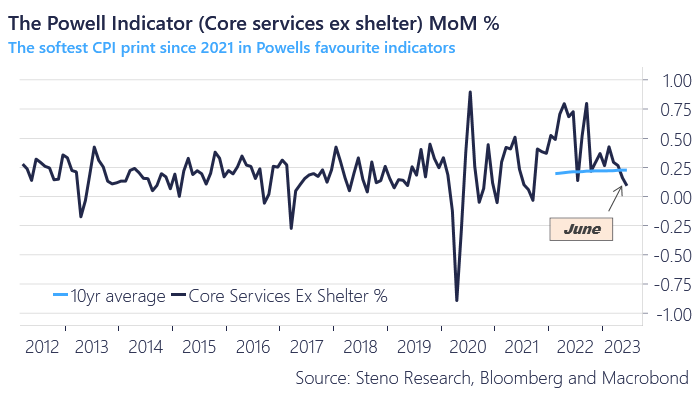
The June US Consumer Price Index (CPI) came in at a 3% annualized rate, down from the pandemic-inflamed peak of 9.1% a year ago. FOMC chair Powell has said that ‘super-core’ services ex-shelter (which excludes food, energy, rent and used car prices) is his preferred inflation gauge, and (as shown below) it came in at 1.4% annualized versus 4% in January, down sharply from 3.1% in May and below the 2.5% average over the two years pre-pandemic (2018 and 2019).

Shelter costs make up more than a third of the CPI index, and year-over-shelter CPI moved lower for a third consecutive month to 7.8% in June from 8.2% in March (the highest since 1982). To reach the 2% CPI target, housing is the bogey that must be deflated, and that means holding the credit hand brake with the good, bad and ugly."

"Focused on that task, the Bank of Canada (BOC) announced another 25bps of monetary tightening, taking its overnight rate to 5% for the first time since April 2001 (!) In addition, the BOC is shrinking its balance sheet (QT) as large amounts of bonds mature and roll off monthly.
Floating rates are immediately affected. That’s good news for savers: the interest rates on investment savings accounts are moving above 5%–a ten-fold increase in 16 months.
For debtors, tough times are getting tougher. Prime borrowing rates offered by commercial banks in Canada are moving to 7.2%, variable rate mortgages around 6% and home equity lines of credit (HELOCs) around 7.7%. Those looking to qualify for new mortgages need to do so in the 8 percent range...Policy tightening is intended to reduce employment (“wage pressures”), and it will. The BOC sees Canadian GDP slowing to a 1% annualized rate in the second half of 2023 and early 2024, with GDP growth of just 1.2% in 2024...
The US Fed is expected to hike another 25 bps at its July 26th meeting. But recessionary odds are mounting that this will be the final hike from central banks in Canada and America. Financial markets are celebrating that thought and the hope that rate cuts will soon come to the rescue.
But here’s the thing: the impact of tighter credit conditions will slow the economy over the next year to 24 months, even if no further hikes take place from here."
See Park's article for additional data.
Contributor James Picerno, in a TalkMarkets Editor's Choice column writes US Stocks Continue To Lead Major Asset Classes In 2023.
"The US stock market remains the clear leader for the major asset classes this year, based on a set of proxy ETFs through Friday’s close (July 7).
Vanguard Total US Stock Market Index Fund (VTI) fell 1.0% last week. Despite the modest pullback, the ETF remains close to a 15-month high following a rally off the October bottom.

Most of the primary slices of global markets are posting gains so far in 2023, including foreign stocks and bonds. The main downside outliers: commodities (GCC) and real estate ex-US (VNQI)."

In the "Where To Invest Department" contributor Zacks Equity Research has 3 Funds To Add To Your Portfolio On Rebounding Semiconductor Sales.
"The recent jump in (semiconductor) sales bodes well for the industry. Demand for semiconductors is expected to soar in the near term due to the widespread adoption and increased use of consumer electronics worldwide, the growing presence of artificial intelligence, the Internet of Things, and machine learning technologies.
3 Best Choices
We have, thus, selected three mutual funds with significant exposure to semiconductor producers carrying a Zacks Mutual Fund Rank #1 (Strong Buy) or 2 (Buy) that are poised to gain from such factors. Moreover, these funds have encouraging three and five-year returns. Additionally, the minimum initial investment is within $5000...
Putnam Global Technology Fund Class A aims for capital appreciation. PGTAX invests primarily in common stocks of large and mid-size companies worldwide.
Putnam Global Technology Fund Class A invests the majority of its assets in securities of companies in the technology industries. Specifically, PGTAX’s returns over the three and five-year benchmarks are 13.3% and 14.8%, respectively.
PGTAX carries a Zacks Mutual Fund Rank #2 and an annual expense ratio of 0.83%, which is below the category average of 1.05%.
Fidelity Advisor Semiconductors Fund has a track of positive total returns for over 10 years. Specifically, FELAX’s returns over the three and five-year benchmarks are 31.2% and 23.3%, respectively.
FELAX has a Zacks Mutual Fund Rank #1 and an annual expense ratio of 1.01%, which is below the category average of 1.05%.
Fidelity Select Semiconductors Portfolio fund seeks capital appreciation. FSELX normally invests at least 80% of assets in common stocks of companies principally engaged in the design, manufacture, or sale of electronic components (semiconductors, connectors, printed circuit boards, and other components); equipment vendors to electronic component manufacturers; electronic component distributors; and electronic instruments and electronic systems vendors.
Fidelity Select Semiconductors Portfolio fund has a track of positive total returns for over 10 years. Specifically, FSELX’s returns over the three and five-year benchmarks are 33.3% and 24.7%, respectively.
FSELX has a Zacks Mutual Fund Rank #1 and an annual expense ratio of 0.69%, which is below the category average of 1.05%."
Caveat Emptor.
Have a good one!

Image: R. Schmitt
More By This Author:
Tuesday Talk: Stocks Break A Losing Streak But Rate Hikes Stalk The Markets
Thoughts For Thursday: Back From The Holiday With Caution


