
Stocks broke a three day losing streak on Monday but US CPI data and the likelihood of a rate hike at the July FOMC meeting stalk the market.

On Monday the S&P 500 closed at 4,410, up 11 points, the Dow closed at 33,944, up 210 points and the Nasdaq Composite closed at 13,685, up 25 points.
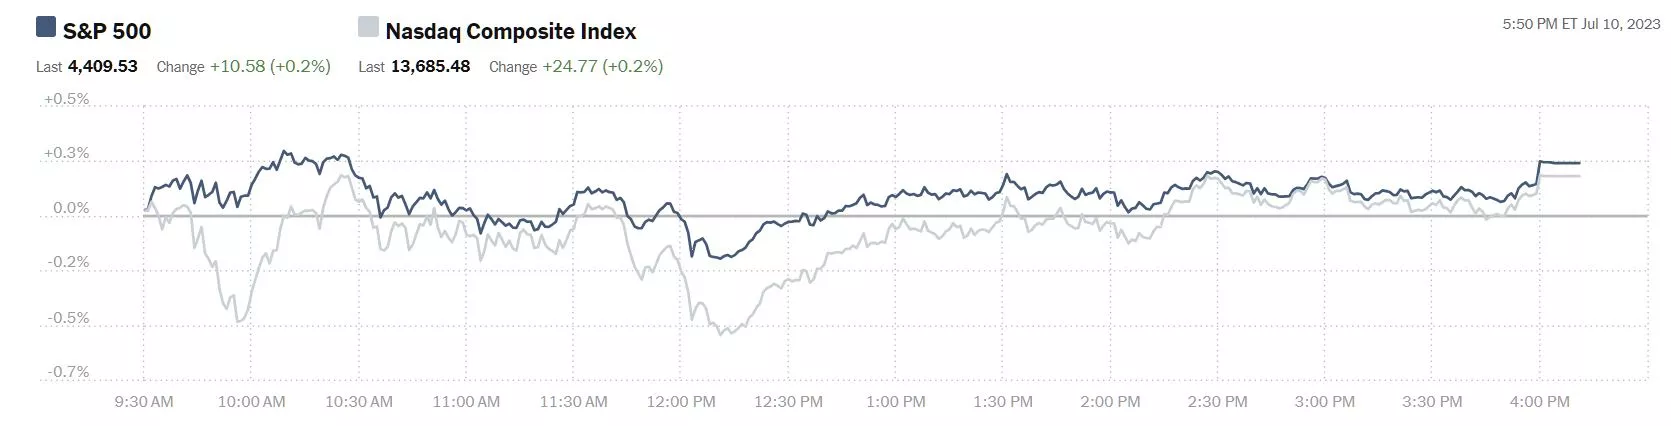
Chart: The New York Times
Most actives were led Tesla (TSLA), down 1.8%, followed by Amazon (AMZN), down 2.0% and Ford (F), up 0.6%.
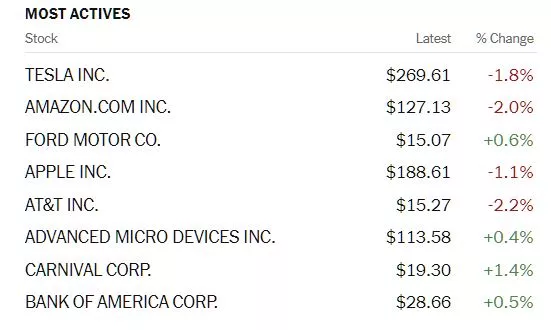
Chart: The New York Times
In morning futures action, S&P 500 market futures are up 7 points, Dow market futures are up 31 points, and Nasdaq 100 market futures are up 32 points.
TalkMarkets contributor Mish Shedlock looks at how debt and rate hikes are impacting consumer spending in Consumer Credit Is Much Weaker Than Expected, Non-Revolving Turns Negative.

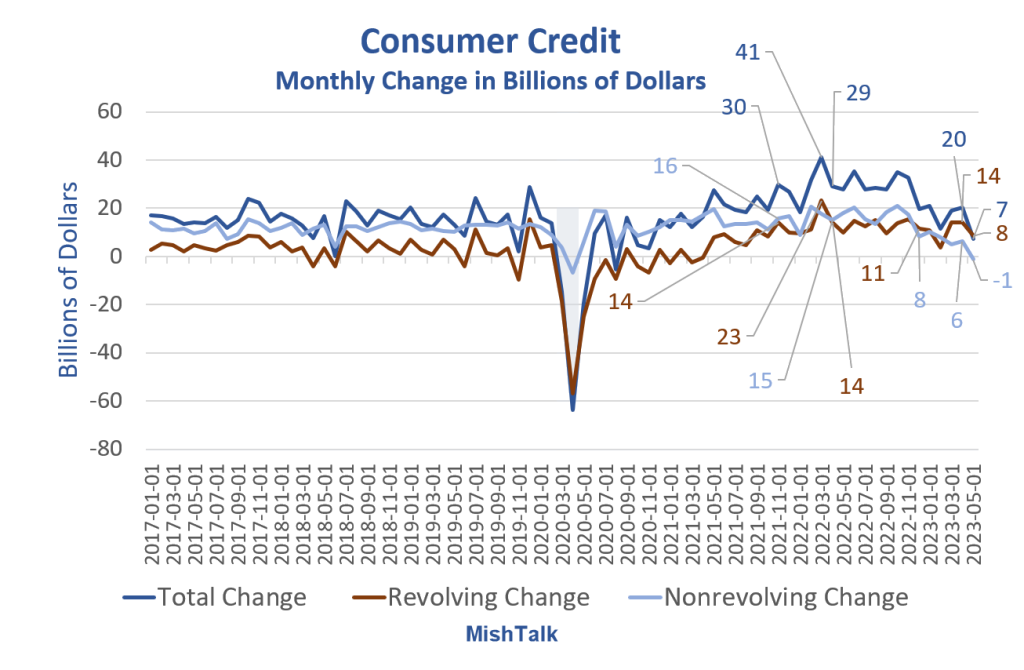
Consumer credit data from the Fed, chart by Mish
"The Bloomberg Econoday consensus was for credit to rise by $20.0 billion.
Instead, the rise was $7.3 billion. In addition, the Fed revised May credit from $23.0 billion to $20.3 billion.
The consumer is clearly weakening as the lead chart shows.
Consumer Credit in Billions of Dollars

Consumer credit data from the Fed, government credit is student loans, chart by Mish
Those are nominal numbers. In nominal terms revolving credit, mainly credit cards, hit a new record high. Inflation adjusted numbers are much weaker.
Adjusted for inflation, revolving credit is still less than the pre-pandemic high.
Real Consumer Credit

Real consumer credit is weakening, especially non-revolving. That reflects a slowdown in autos, housing, and student debt."
There are some additional charts in the full article.
Contributor Chris Ciovacco looks at Stocks: The Longer-Term View.
"If the S&P 500 made a cyclical low in October 2022 in the context of a secular bull market, when we look back in 2-3 years, ETF leaders will most likely come from the technology sector, with a large cap bias. Even if mid-cap and small-cap stocks continue to lag, they will experience intermittent periods of outperformance (countertrends in the context of a long-term relative downtrend). A bias toward higher interest rates and higher inflation, along with current long-term trends, say bonds may produce disappointing relative performance."

"Markets move in fractals, which means they exhibit similar behavior and produce similar patterns on multiple timeframes. Thus, the concept that after a big move ‘the market needs to consolidate its gains’ applies to S&P 500 charts spanning decades."
Interest piqued? See Ciovacco's article for a series of historic charts that track the trends in the indices, sector ETFs and bonds and reflect his thesis above.
TM contributor Paul Schatz has some very specific advice for investors in More Bullish Setups In The S&P 500 – Don’t Ignore The Dow Industrials.
"Friday was an ugly day. While the indices showed very modest losses, they, were strong in the morning, lost all of the gains, and then some before closing at the lows of the day. In a vacuum that would suggest a short-term peak...Below is the S&P 500. It’s hard to see but it closed down on Wednesday, Thursday, and Friday after just closing at a fresh 52-week high. This is just another in a long line of positive trends for the market. The setup for stocks remains bullish. Weakness should be bought until proven otherwise...I can even make a less bullish summer case for 4150, but other things would have to set up. And regardless of the pullback which I think is mild to modest at worse, we should see the S&P 500 continue to make further new 52-week highs this quarter and year."

See the article for Schatz's take on the Dow.
Bank earnings are first up for Q2 reporting and our next three contributors have a few things to say about some specific stocks and the sector in general.
Mish Schneider highlights Bank Earnings - JP Morgan Versus Goldman Sachs.
"JP Morgan kicks off earnings season this Friday July 14. Goldman Sachs does not report until next week July 19."

"J.P. Morgan’s stock looks very different from Goldman Sachs's stock. Besides revs from asset and wealth management, JP Morgan does lending-related operations, comprised of consumer lending, credit cards, and mortgages. Goldman Sachs provides mainly asset and wealth management. That has not been a highly profitable area of banking in 2023.
JP Morgan has over three times the amount of assets as Goldman Sachs and generates over three times the net revenue.
What could happen to each stock technically?
The daily chart of JP Morgan (JPM) is in a bullish phase and has been for most of the year.
However, it has not been impervious to corrections. In late June we have one example where JPM tested the 50-DMA.
On July 3, JPM made a new 52-week high and then gapped lower.
Our Real Motion indicator shows a similar mean reversion around the same time. Plus, momentum is still sideways, but not as strong as price.
For the earnings, the stock must hold above 140. It also has to take out the reversal top high at 147.50 to keep heading north.
Goldman Sachs (GS) is in a bearish phase. What this chart does not show is the higher lows at every price drop since June 2022.
The low from June 28 followed by the gap higher the next day is the risk point going into earnings.
Zooming out, GS is not above the 23-month MA while JPM is.
Daily momentum on GS also had a mean reversion, the opposite of JPM’s as GS is a bottoming one, JPM is a topping one.
For earnings, should GS clear back over 330, then one can assume the investment banking side of their business is picking up. And that would make sense as many money managers are throwing in the bear towel and starting to buy.
In fact, if you are a contrarian, it could be that JPM’s credit card and lending side falters and the stock drops further into the end of the year.
Meanwhile, it could also be that GS sees a boost from the investment side and works its way higher."
Clay Webster writes Bank Earnings Back In Focus As Index Readies For CPI.
"The S&P 500 index will most likely remain subdued for several weeks as the market now largely expects the Federal Reserve to raise interest rates by 25 basis points at its Federal Open Market Committee (FOMC) meeting on July 26.
Two events that could shake the market out of its daze are the Consumer Price Index (CPI) data for June that arrives on Wednesday and then the debut of the second-quarter earnings season that begins with major banks on Thursday and Friday."

"JPMorgan Chase, Wells Fargo (WFC), State Street (STT), BlackRock (BLK), and Citigroup (C) all report earnings on Friday. JPMorgan, Citigroup and Wells Fargo have all recently passed the Fed’s banking stress tests with flying colors, and so investors will now listen to earnings presentations to glean what the big banks will do as far as raising dividends and hiking buybacks.
Wall Street expects JPMorgan, the largest bank in the US, to earn $3.90 in GAAP earnings per share (EPS) on $38.91 billion in revenue. The Wells Fargo consensus calls for GAAP EPS of $1.18 on revenue of $20.08 billion. Citigroup is expected to earn $1.40 in GAAP EPS on revenue of $19.58 billion.
Wells Fargo and Citigroup differ from JPMorgan since the former two have seen a majority of analysts hit them with downward revisions to earnings for the second quarter. JPMorgan, on the other hand, has only received upward revisions over the past 90 days."
Chartist Chris Kimble closes us out with a question, If Rates Break Out Here, Will Banks Continue To Tank?
"It’s always nice to see bank stocks leading the market higher… but it doesn’t always work out that way...
For most of my career, though, bank stocks have liked rising interest rates.
BUT for the past 2 years, interest rates have risen nearly 5 percent and the all-important
KBW Bank Index (for bank stocks) has declined nearly 50%...
You can see this in today’s chart, where we compare the Bank Index to the 2-Year Treasury Bond Yield.
As you can see, the 2-year yield is testing its 2007 highs.
As this occurs, a couple of questions come to mind… what if interest rates peak here, what will banks do? What if rates breakout, what will banks do???
This dynamic is definitely worth watching. Add it to your trading radar."

That's a wrap for today.
As always, caveat emptor.
Have a good one!
More By This Author:
Thoughts For Thursday: Back From The Holiday With Caution
Tuesday Talk: A Glorious First Half And A Glorious Fourth


Comments
Log in or sign up to join the conversation.