
Headline and core are both at 0.2% m/m, vs. Bloomberg consensus at 0.3%. Here’s picture of m/m, y/y, and instantaneous (Eeckhout 2023, T=12,a=4).
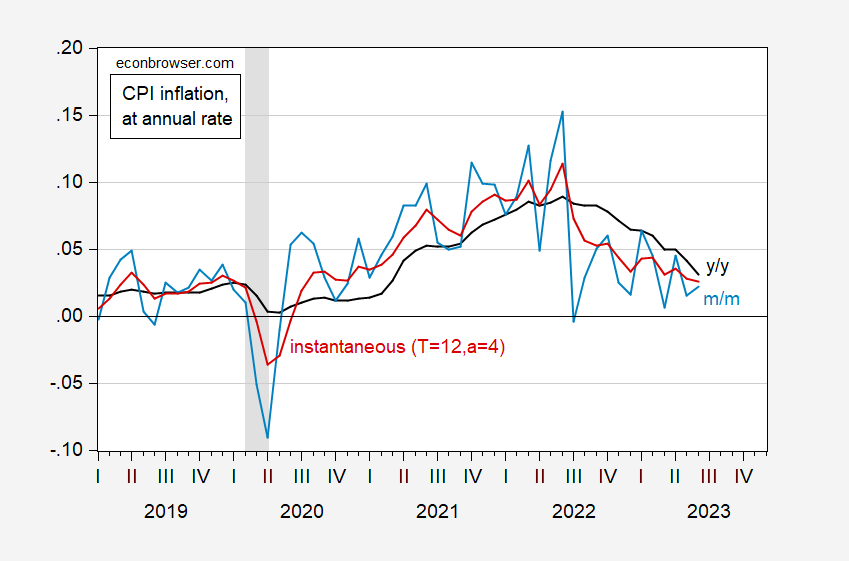
Figure 1: Year-on-year headline CPI inflation (black), month-on-month (light blue), and instantaneous (T=12, a=4) (red). NBER defined peak-to-trough recession dates shaded gray. Source: BLS, NBER, and author’s calculations.
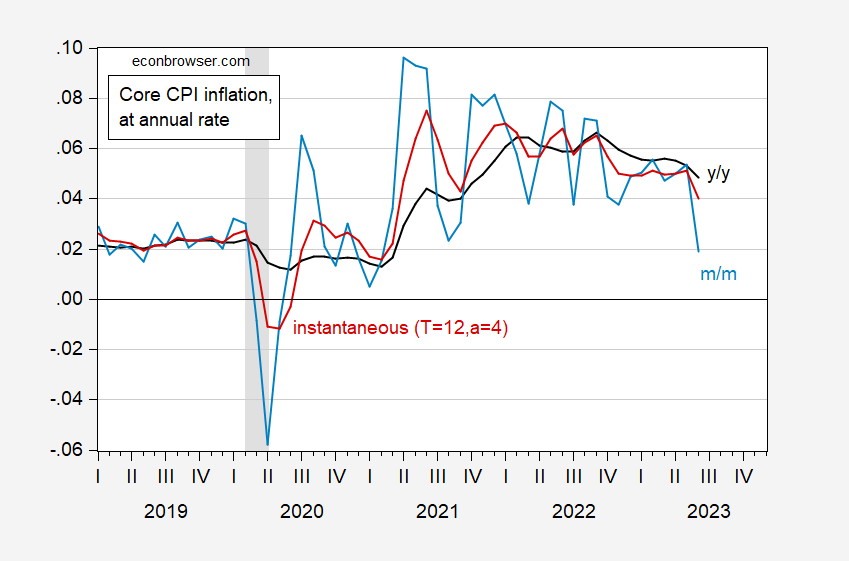
Figure 2: Year-on-year core CPI inflation (black), month-on-month (light blue), and instantaneous (T=12, a=4) (red). NBER defined peak-to-trough recession dates shaded gray. Source: BLS, NBER, and author’s calculations.
So, short horizon movements are in the same direction as the year-on-year that are the focus of popular discussion. The trend as proxied by Eeckhout (2023)‘s measure of instantaneous inflation is the same (downward). Core m/m is 1.9% annualized, while it’s 4% using instantaneous.
For reference, here are the various price indices in levels.

Figure 3: CPI (black), core CPI (gray), PCE deflator (blue), core PCE deflator (light blue), and HICP (red), all in logs 2020M02=0. NBER defined peak-to-trough recession dates shaded gray. Source: BLS, BEA via FRED, NBER, and author’s calculations.
More By This Author:
More On NFP Employment OverestimationChina, Mid-2023: Teetering On Deflation
Alternative Readings On Private And Total Nonfarm Payroll Employment


Comments
Log in or sign up to join the conversation.