
NFP surprised on downside slightly; however, alternative measures indicate continued growth through at least May. That characterization also applies to private NFP.
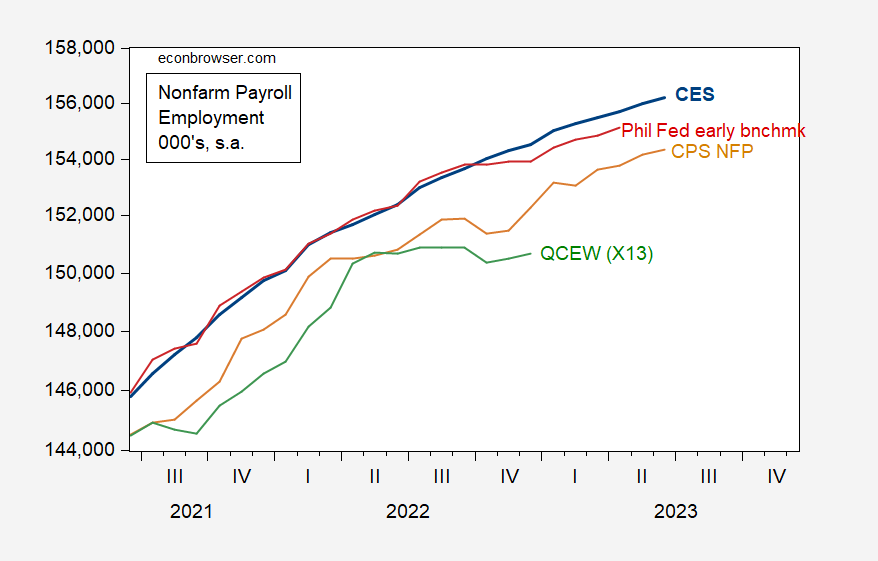
Figure 1: Nonfarm payroll employment from CES (blue), CPS household series adjusted to NFP concept (tan), QCEW total covered aggregate, seasonaly adjusted using X-13 (green), all in 000’s, s.a. Source: BLS via FRED, BLS, BSL-QCEW, Philadelphia Fed.
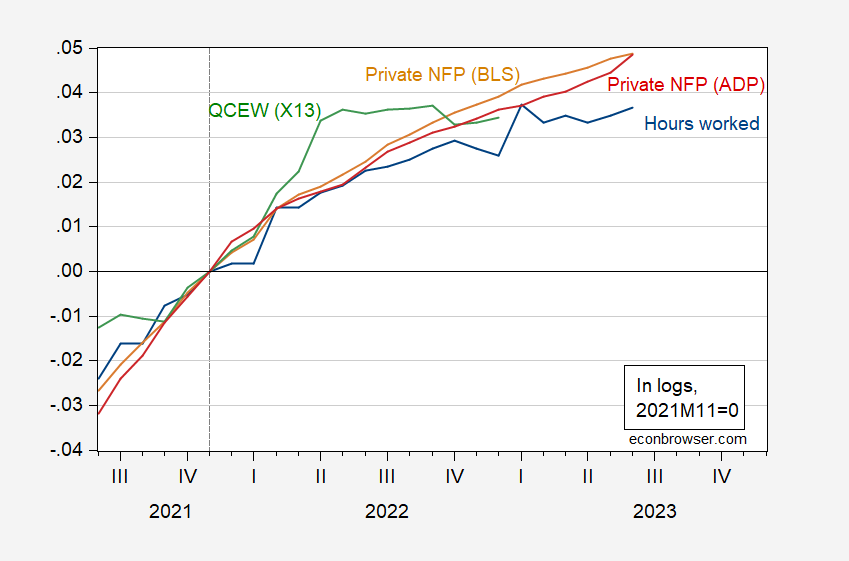
Figure 2: Private NFP from BLS CES (tan), private NFP from ADP (red), private QCEW seasonally adjusted aggregate using X13 (green), and aggregate weekly hours worked (blue), all in logs, 2021M11=0. Source: BLS, ADP via FRED, BLS-QCEW, and author’s calculations.
While nominal wages continued to rise in June, real wages — as calculated using the Cleveland Fed nowcast for June, are pretty flat. That being said, real wages have been rising for total employment since June of 2022. Leisure and hospitality production and nonmanagerial workers have seen their wages rise by 7.2% since the NBER defined peak at 2020M02.
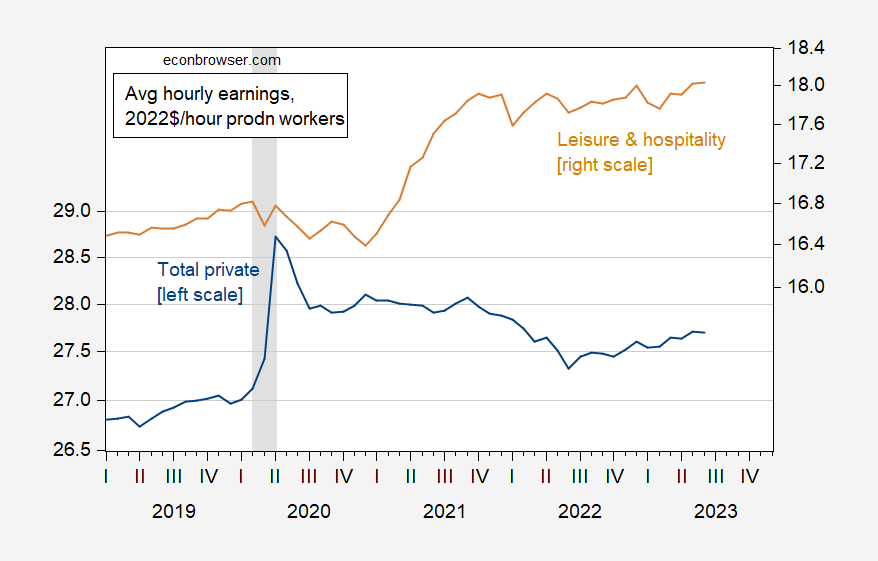
Figure 3: Average hourly earnings in total private nonfarm (blue, left log scale), and in leisure and hospitality services (tan, right log scale), both in 2022$ (CPI-all deflated). June observation uses CPI nowcast from Cleveland Fed as of 7/9/2023. NBER defined peak-to-trough recession dates shaded gray. Source: BLS via FRED, Cleveland Fed, NBER, and author’s calculations.
Total private hourly earnings are 2.1% above NBER peak levels.
More By This Author:
Business Cycle Indicators As Employment Growth DeceleratesThe Manufacturing Construction Boom And Nonresidential Investment
June Private NFP Nowcasted, Based On ADP Series


Comments
Log in or sign up to join the conversation.