

Nonfarm payroll employment surprises on the downside, while preceding months are revised down. Here’s the picture of key indicators followed by the NBER BCDC, along with monthly GDP (SPGMI).
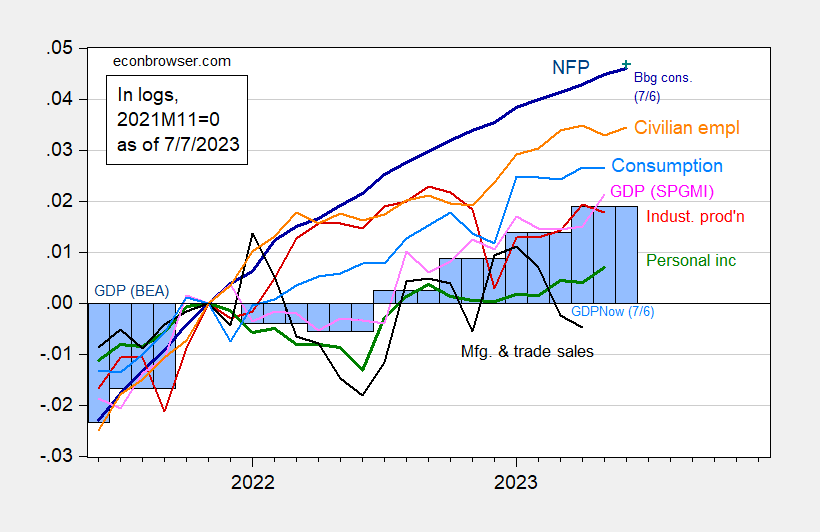
Figure 1: Nonfarm payroll employment, NFP (dark blue), civilian employment (orange), industrial production (red), personal income excluding transfers in Ch.2012$ (green), manufacturing and trade sales in Ch.2012$ (black), consumption in Ch.2012$ (light blue), and monthly GDP in Ch.2012$ (pink), GDP (blue bars), 2023Q2 is GDPNow of 7/6, all log normalized to 2021M11=0. Bloomberg consensus level calculated by adding forecasted change to previous unrevised level of employment available at time of forecast. Source: BLS, Federal Reserve, BEA 2023Q1 3rd release via FRED, Atlanta Fed, S&P Global/IHS Markit (nee Macroeconomic Advisers, IHS Markit) (7/3/2023 release), and author’s calculations.
More By This Author:
The Manufacturing Construction Boom And Nonresidential Investment
June Private NFP Nowcasted, Based On ADP Series
On The Reliability Of Non-Renewables Energy Production: Texas, June 18, 2023


Comments
Log in or sign up to join the conversation.