Tuesday Talk: Too Hot, Too Fast?
The market put the brakes on its climb upwards just as the IMF released an improved outlook for worldwide inflation. Most likely FOMC meeting jitters, as well as debt ceiling issues acted as catalysts.

At the end of trading on Monday the S&P 500 was down 53 points, closing at 4,018, the Dow was down 261 points, closing at 33,717 and the Nasdaq Composite closed at 11,394, down 228 points.

Chart: The New York Times
The down mood carried over to trading in global markets on Tuesday, with Asia closing lower and European bourses starting the day on the red end of the spectrum.
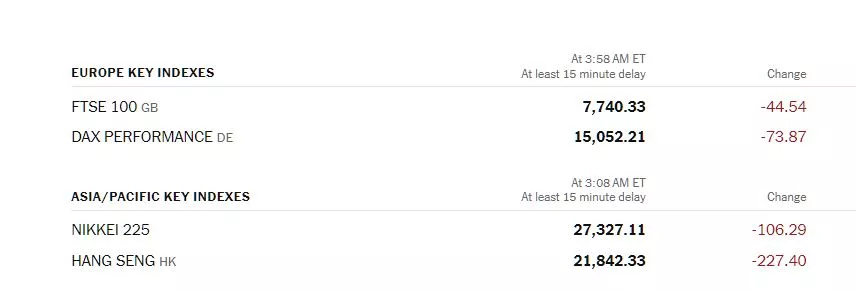
Chart: The New York Times
In morning futures action, S&P 500 market futures are down 15 points, Dow market futures are down 113 points, and Nasdaq 100 market futures are trading down 77 points.
Looking at Monday's action in the charts, contributor Declan Fallon says 'Bull Traps' Threaten Nasdaq And Russell 2000.
"What goes up may come down, or at least, the nascent breakouts in the Nasdaq and Russell 2000 now find themselves on the wrong side of support. It hasn't been a total collapse, selling volume was down on Friday's buying, and the potential for a recovery is quite high."
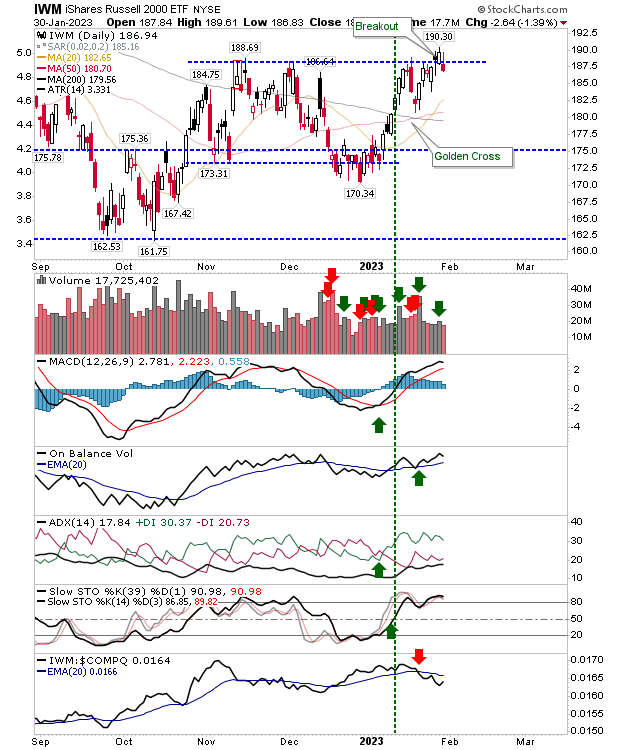
"The Russell 2000 (IWM) is underpeforming the Nasdaq, so it's the most vulnerable to further selling. Even if the 'bull trap' is confirmed, I would still look for the potential of the 20-day MA to play as support."
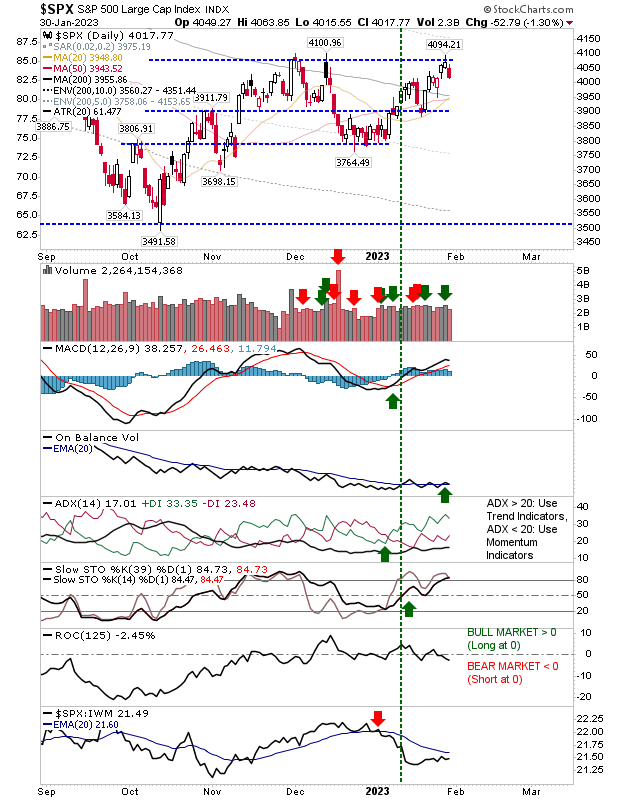
"The S&P didn't have a breakout to lose, so there would have been no technical alert for this index to reverse. It's as you were for the index, but one thing I like is the pending 'golden cross' between the 50-day and 200-day MAs which might be the driver for a breakout. In such a scenario, I would be looking for the Russell 2000 to lead out and the S&P to follow...
The loss of the breakout in the Nasdaq didn't do too much damage to the supporting technical picture, but I wouldn't want to see too much of a move away from its 200-day MA...
For the rest of the week, if ex-breakout indices are able to hold on to moving average support - and this could be any of 20-day, 50-day or 200-day MAs - then I wouldn't be too worried about today's breakout losses."
Contributor Bob Lang explains What The Breadth Indicators Are Telling Us.
"As a technician, I am constantly looking under the hood of the markets to understand current or new trends. According to the breadth indicators, we could be at a turning point. I cannot say a new bull market is underway (or that we are close to one), but I can say some bullish qualities are starting to emerge."

" Breadth indicators help us determine the health of the markets and whether a trend is sustainable or short-lived. New highs vs new lows is an intermediate-term breadth indicator. I look at whether stocks are moving higher with the market. Are they making new 52-week highs or simply churning?...
Over the past year, we have not seen stocks make too many new highs, but recently the bulls have flexed their muscles and suddenly more new highs are appearing. That is encouraging, because as long as this trend stays firm, the dip buyers will come in and pick up the markets during down sessions (this happened last week). The accumulation of positive readings is very bullish.
The McClellan oscillator is a short-term indicator that provides daily readings on breadth. Recently, a massive and extreme overbought reading occurred, and the market sold off quickly. I expected the indicator to reset at zero (a neutral reading), but it did not. Instead, it pushed higher. That is a healthy bullish sign for the markets.
Keep your eye on both these indicators, as they provide accurate and factual information about the health of the markets. If stocks continue to make new highs and the McClellan oscillator stays in positive territory, we may consider moving more capital into the market. But until a bull market is firmly established, I’ll continue to treat every move higher as a bear market rally."
TalkMarkets contributor Michele Schneider, who follows a specific set of ETFs asks What Are The Equities Market’s Warning Signs?
"Nearly every member of Mish’s Modern Family improved last week...except for Regional Banks KRE."

"Risk off or on during this data-heavy week?
Clearly, the performance of MarketGauge’s Trend Strength Indicator (TSI) improving across all 4 key indices, with the Small Caps (Russell 2000) and the Dow (DIA) leading the bunch points to risk on.
Risk off
However, some areas should keep investors on their toes.
The 52-week New High / New Low ratio for the Nasdaq Composite has actually begun to deteriorate, a clear Risk-Off indication for the short term.
And, despite the improvement in the market, the Yield Curve has actually continued to invert further.
Regional Banks KRE have not had a golden cross (the 50 daily moving average clears above the 200-DMA).

"Another member of the Economic Modern Family, Transportation (IYT) is also flashing a warning on the weekly chart."

"Note that IYT has failed to clear the 50-week moving average (blue line). Also note the slope on the 50-WMA is negative.
IYT is beginning to underperform the SPY and momentum according to Real Motion is slipping lower. Also interesting to observe is that the momentum moving averages had a death cross in early November.
Transportation and Regional Banks make up nearly 1/3 of the Economic Modern Family.
Of course, the week is young, so we have time to see if both sectors play catch up or are sending us a meaningful warning message.
Either way, they are not to be ignored."
In commodities markets, TM contributor James Hanshaw, in a TalkMarkets "In The Spotlight" article, writes that LNG Shipping Cannot Keep Up With World LNG Demand. Here is some of what he found:
"Overall global LNG demand is now around four times what it was in 2000 and liquefaction capacity is expected to increase by 30% by 2025/26.
Europe has already tapped almost every available source of natural gas, from increased LNG imports to asking Norway to maximize pipeline deliveries for months. The EU will boost its ability to import LNG through floating terminals in Germany and the Netherlands but they’ll be competing for the same limited pool of world supply. And without Russian gas, the EU will need even more LNG over the next 12 months and coming years."
"In Germany - the EU’s economic leader - the manufacturing sector’s scope for further natural gas savings is dwindling with only ~39% of companies saying they would be able to reduce their consumption without decreasing production.
Germany has finished construction of its first import terminal for liquefied natural gas, a crucial milestone in its efforts to end its energy dependency on Russia. The completion of the terminal, at Wilhelmshaven on the North Sea, will ease fears that Europe’s largest economy might face gas rationing this winter."
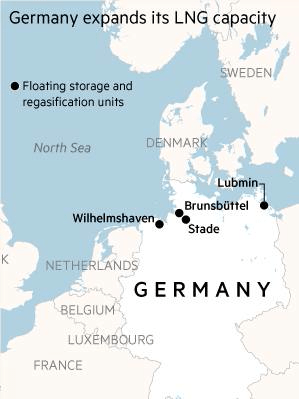
Picture source: Financial Times
"Earlier this year, it chartered five floating storage and regasification units (FSRUs), one of which will be installed at Wilhelmshaven and the other at nearby Brunsbüttel by the end of the year. The first LNG tankers are due to dock at the two sites early this year."
"Asia’s (LNG) needs are massive too, led by China and Japan with India’s needs growing fast too - it has recently ousted the UK as the 5th largest economy in the world and some forecasts say it will be the 3rd largest by 2030, with the US and China remaining as 1st and 2nd.
"That LNG has to be shipped from producer to user and there is a shortage of ships.
Shipbuilders enjoyed a record year for liquefied natural gas tanker contracts in 2022 and they expect the boom to continue for some time as demand for the fuel rises. According to Refinitiv, global orders for the vessels reached 163 in 2022, more than double the figure in 2021 and the highest since 2011, the earliest data available.
A large number of those orders were tied to Qatar’s expansion of its North Field project, a plan to increase the Gulf state’s LNG export capacity from 77mn tons a year now to 126mn tons by 2027. The International Gas Union estimates that the North Field project alone would need about 150 LNG carriers.
More LNG export terminals are being built in the US which is now the largest supplier of LNG to Europe.
Rising labor and steel price costs mean that the average cost of an LNG tanker rose to $250mn in 2022, from $200mn in 2021, according to industry experts.
Similar cost increases apply to building new FSRUs."
After laying out the scene, Hanshaw then suggests two ways investors can profit from the boom in the LNG market.
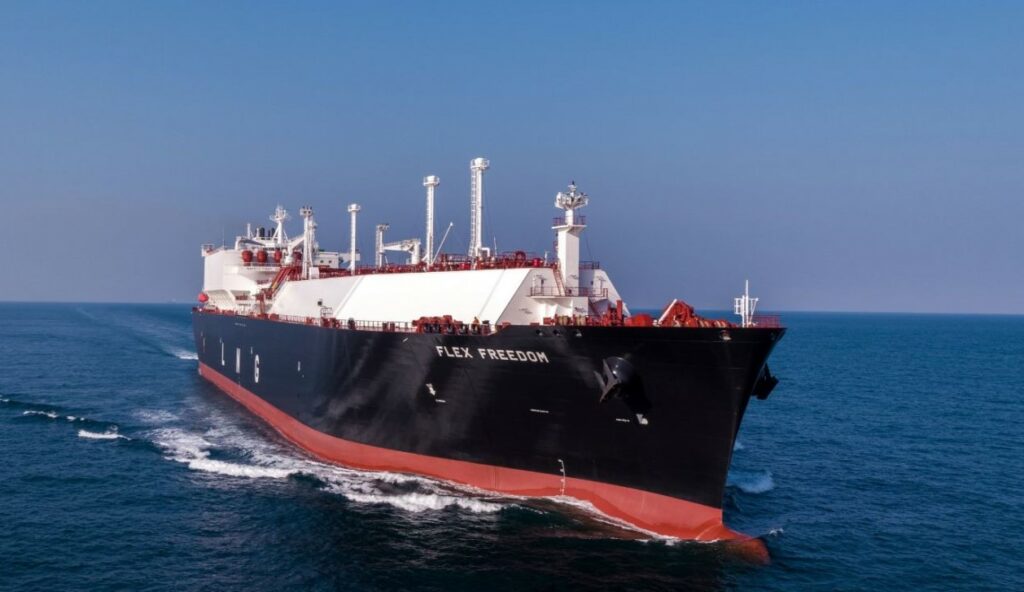
Photo courtesy of Flex LNG
"Flex LNG is not yet a well-known company. It was listed on the Oslo exchange until June 2019 when Flex LNG was also listed on New York Stock Exchange, also under the symbol (FLNG). It is an LNG shipping company with a fleet of thirteen fuel-efficient, fifth-generation LNG carriers...I mentioned earlier that rising labor and steel price costs mean that the average cost of an LNG tanker rose to $250mn in 2022, from $200mn in 2021. Their fleet has been acquired at historically attractive prices compared to the new building prices today, while book equity values reflect historical costs adjusted with regular depreciation."
"(Likewise), Execelerate Energy (EE) is relatively unknown to investors yet it has one of the world's largest fleets of floating storage and regasification units (FSRUs). They take LNG off trans-ocean vessels and convert the LNG back into normal natural gas to go into a country's pipeline infrastructure...
Its main focus has been providing flexible LNG solutions to emerging markets around the world. The company operates a fleet of ten purpose-built floating storage and regasification units (FSRUs), has completed more than 2,400 ship-to-ship transfers of LNG with over 40 LNG operators and delivered more than 5,900 billion cubic feet of natural gas through 15 LNG regasification terminals. That is more than any other company in the industry and - like FLNG's vessels - they were all bought at much lower prices than new builds today. "
See the full article for further details, Hanshaw himself says that he "shall be a long-term holder of both".
Caveat Emptor x 2!
Rounding out the column today, contributor Zacks Equity Research weighs in with Meta Platforms To Report Q4 Earnings: What To Expect.
"Meta Platforms (META - Free Report) is set to report its fourth-quarter 2022 results on Feb 1...
The Zacks Consensus Estimate for fourth-quarter revenues is pegged at $31.31 billion, indicating a decrease of 7.02% from the year-ago quarter’s reported figure.
The consensus mark for earnings is pegged at $2.23 per share, up 4.7% over the past 30 days, suggesting a decline of 39.24% from the figure reported in the year-ago quarter."
"Meta’s fourth-quarter top line is expected to have been affected by a challenging macroeconomic environment, high inflation, and rising interest rates hurting the ad spending budgets of enterprises. This is expected to have weighed on the ad revenues of Meta in the to-be-reported quarter...
In the third quarter of 2022, Meta’s ad revenues represented 98.3% of the total revenues, which decreased 3.7% year over year to $27.24 billion. The declining revenue trend is expected to have continued in the fourth quarter.
Nevertheless, Meta is banking on adding users, driven by features like protections against malicious links in Facebook messenger and Instagram direct messages using automated systems, Instagram impostor alerts, and increased Instagram verified badge specialty...
Per the Zacks model, the combination of a positive Earnings ESP and a Zacks Rank #1 (Strong Buy), 2 (Buy) or 3 (Hold) increases the odds of an earnings beat.
Meta currently has an Earnings ESP of +13.39% and a Zacks Rank #3."
Can't wait till tomorrow. ![]()
Have a good one.
More By This Author:
TalkMarkets Image Library
Thoughts For Thursday: Holding The Line
Tuesday Talk: To The Moon With QT!


Good post.
Thanks for linking to the article by James Hanshaw, it was very enlightening.