
Thoughts For Thursday: Markets Higher And Halloween Closer
As markets go higher and Halloween gets closer it's time for a mid-week check-in. Wednesday the markets continued their upward swing, though the Nasdaq seemed to lose steam about mid-day. This morning the market seems to have something of a hangover as futures are currently trading in the red, S&P futures are currently trading down 8 points, Dow futures down 74 points and Nasdaq futures down 30 points.

At the close of Wednesday trading the S&P 500 was up 17 points to close at 4,536, the Dow was up 152 points to close at 35,609 and the Nasdaq Composite was down 7 points to close at 15,122. Top gainers yesterday were Healthcare issues such as Anthem (ANTM) +7.7%, Centene (CNC) +5.2% and Cigna (CI) +3.9%. as well as bank stocks, Ford (F) + 4% and electric utility AES Corp. (AES) +3.6%.
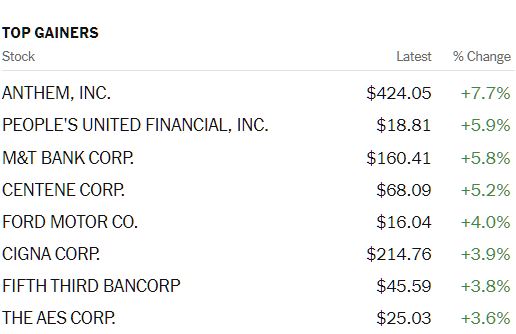
Chart: The New York Times
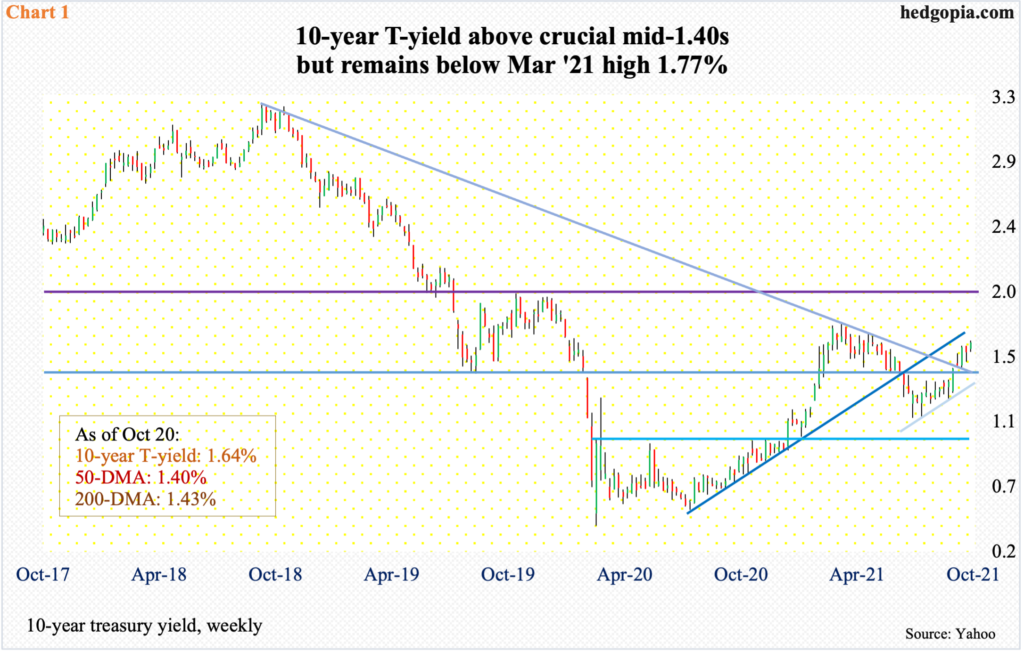
Starting off in the safe haven department TalkMarkets contributor Paban Pandey charts what has been going on with demand for Treasuries in his article 10-Year T-Yield Caught Between Increased Demand From Foreigners And Imminent Tapering.
"Bond bears are probably not happy how things seem to be unfolding in the supply-demand dynamics for US treasury notes and bonds. Foreigners could be throwing a monkey wrench in their bearish outlook for long bonds. The 10-year treasury yield has trended higher since March last year after tumbling to as low as 0.40 percent, and particularly since early August this year when rates bottomed at 1.13 percent. Subsequently, the 10-year broke out of mid-1.40s in the last week of September...On Wednesday, rates tagged 1.64 percent – just under the daily lower Bollinger band – before ending the session at 1.64 percent, which was a five-month high."
See the full article for Pandey's analysis of how foreign demand for Treasuries could throw a wrench in the works of those playing the "shorts" game.
Economist and TM contributor Menzie Chinn charts the Treasury Ten Year Yield Forecasts and finds that "the trajectories are all upward".
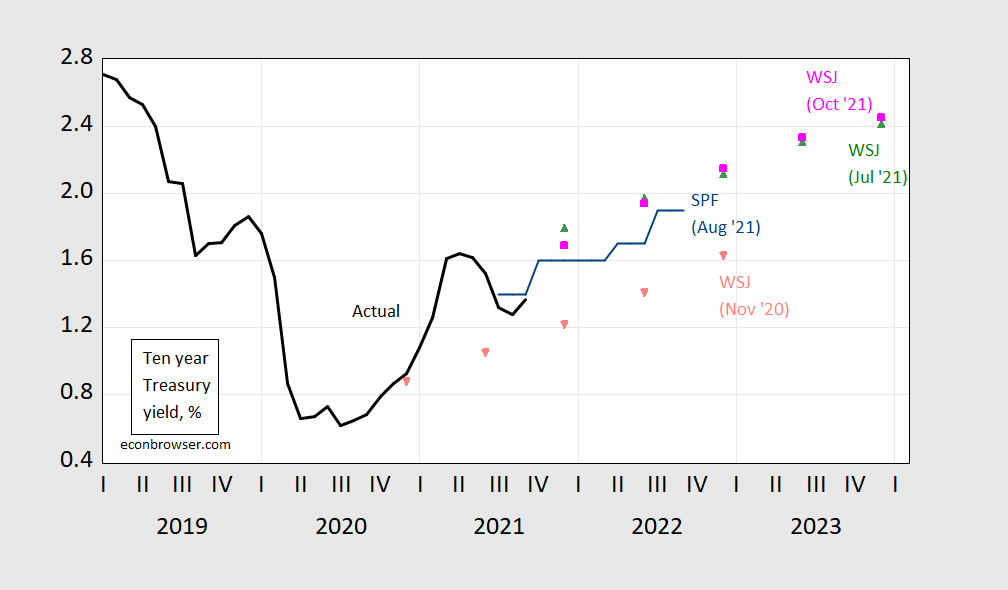
"Interest rate on 10 year Treasury bond actual (black), mean forecast from November 2020 WSJ survey (salmon inverted triangle), from July 2021 (green triangle), from October 2021 (pink square), and August 2021 Survey of Professional Forecasters. Source: Federal Reserve Board via FRED, WSJ (various surveys), and Philadelphia Fed."
Apropos of Tuesday's launch of the ProShares Bitcoin Strategy ETF (BITO) contributor Jill Mislinski apprises readers of what's going in the crypto market in her update of Cryptocurrencies Through Oct. 20. Mislinski charts four of the major cryptocurrencies individually (price and volume over time), as well as together (see below).
"We have (also) created an index in order to chart these together given their very different pricing history. Notice that Ether (ETH-X) tops the chart - the price of an ether has changed the most out of all three cryptocurrencies. Tether has shown virtually no movement due to its "stable coin" feature."

For mid-week reactions to the market action thus far, we turn three of our market focused contributors. First is Anna Coulling who cautions that US Indices Push Higher, But For How Much Longer?

"Whilst I don’t wish to rain on anyone’s parade, the volume associated with the last six days is showing a worrying trend, and it’s not a positive trend either. As can clearly be seen, volume is declining while the price is ascending and as such presents a clear anomaly for Wyckoff students. For such a move we should expect to see volume rising and not falling...We are approaching the previous top of late August at 4540 which triggered the reversal into September...enjoy the ride higher, but the warning flags are fluttering in the strengthening breeze."
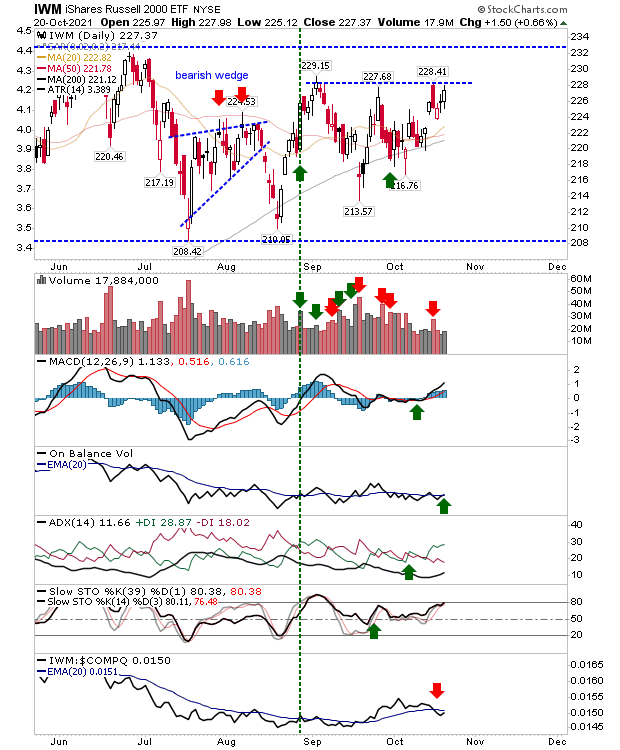
Contributor Declan Fallon writing in S&P Challenges All-Time Highs has these things to say about the Nasdaq (QQQ), S&P 500 (SPY) and the Russell 2000 (IWM).
"The Nasdaq broke through resistance (former support) defined by the July and August swing lows it has managed to hang on to regained support. Technicals are net positive and the index is again outperforming the Russell 2000. It still has some way to go before it challenges the September high and finished today with a small bearish candlestick."
"The S&P has managed to reach a point to challenge the August high. It managed to do so on higher volume accumulation, although following the sequence of bullish white candlesticks I would expect it to now consolidate - perhaps forming a 'bull flag' before forming new highs."
"The Russell 2000 retains its range-bound action, although I have drawn in a second resistance level which may be enough to qualify it for a breakout if it can get past this level. Remember, triple tops are rare, and here we are looking at a triple top - which means the chance for a breakout is high."
See the article for the other charts.
Contributor Michael Kramer notes that Stocks Rise On October 20 To A Critical Level Of Resistance. He gives some general remarks about the market as well as chart updates for Tesla (TSLA) and Lam Research (LRCX). Here is what Kramer has to say about the S&P 500 (SPX).
"The S&P 500 made it back to the February trend line and pretty much stopped at that point. We gapped below that trend on September 17 and have now risen back to it. At this point, the bulls need to gap over that trend line tomorrow to keep the rally alive. If the trend in the market has shifted to one that is lower, then this recent move up is simply a retest of that breakdown. If we start heading lower and then fall back below 4,430, I would look for the lows of early October to fall."
With the light shining on healthcare sector equities yesterday we close out with Zacks Equity Research who pen the following suggestions in 3 Healthcare Mutual Funds To Add Stability To Your Portfolio .
"One of the best ways to safeguard investments is by parking money in the healthcare sector. This is because demand for healthcare services does not change with market conditions...Mutual funds are the perfect choices for investors looking to enter this sector since they possess the advantages of wide diversification and analytical insight.
Fidelity Select Health Care Portfolio (FSPHX) is a non-diversified fund that aims for capital appreciation. The fund invests the majority of its assets in common stocks of companies engaged in designing, manufacturing, or sale of products or services related to healthcare or medicine...FSPHX has three-year annualized returns of 14.2%. As of the end of August 2021, FSPHX held 132 issues with 9% of its assets invested in UnitedHealth Group Inc.
Fidelity Select Biotechnology Portfolio (FBIOX) fund invests the majority of assets in the securities of companies that are mostly engaged in the research, development, manufacture and distribution of biotechnological products and services...The fund has returned 11.7% in the past three years.
Fidelity Select Medical Technology and Devices Portfolio (FSMEX) fund aims for capital growth. It invests the majority of its assets in companies that are engaged in activities such as research, manufacturing, supply and sale of medical equipment and related technologies...FSMEX has three-year annualized returns of 33.1%."
The above comments are abbreviated. See the full article for more details.
As always, caveat emptor.

I'll be back on Tuesday. In the meantime (if you haven't) get your COVID shots and your Flu shot.
Have a good one.


Worthwhile advice about getting into healthcare systems. Certainly not so dependent on the rest of the market, although still subject to most other business woes.
Thaks for the interesting and useful read!
👍🏽