
Treasury Ten Year Yield Forecasts
Little changed from July, at least from the Wall Street Journal’s survey of economists:
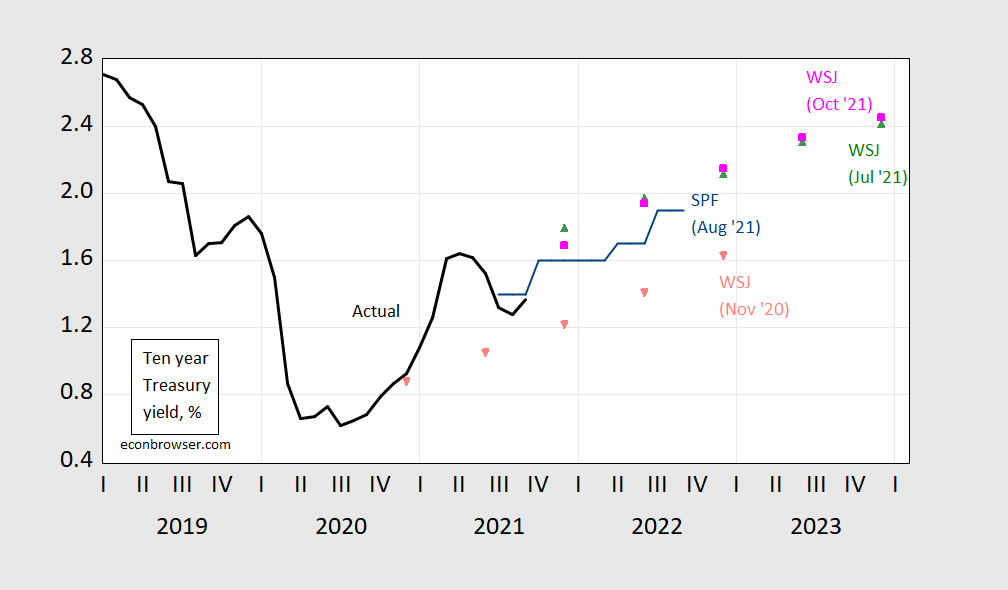
Figure 1: Interest rate on 10 year Treasury bond actual (black), mean forecast from November 2020 WSJ survey (salmon inverted triangle), from July 2021 (green triangle), from October 2021 (pink square), and August 2021 Survey of Professional Forecasters. Source: Federal Reserve Board via FRED, WSJ (various surveys), and Philadelphia Fed.
Unlike the forecasts of the GDP level (see this post), interest rate trajectories shifted upward from November 2020 to July 2021, and have ended up roughly the same by October. Of course, we don’t know how to apportion between interest rates and expected inflation the upward shift relative to November for the July and October forecasts.
As remarked upon in a previous post, the trajectories are all upward. This is a characteristic of these consensus forecasts since 2003 (here’s the relevant figure):
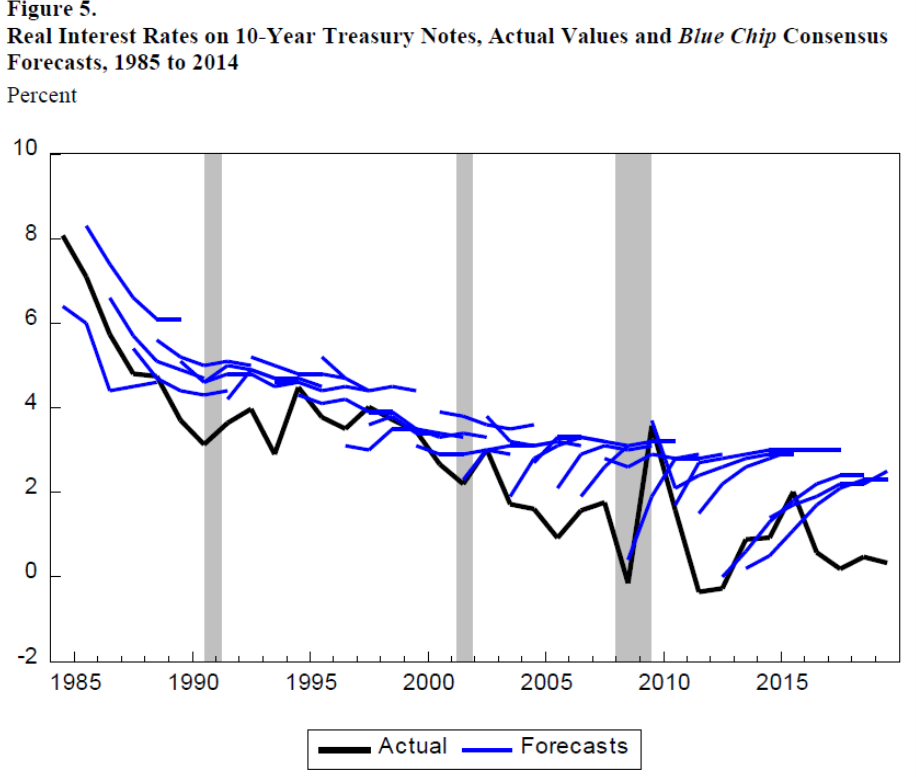
Source: Gamber (2020).
Disclosure: None.


