
US Indices Push Higher, But For How Much Longer?
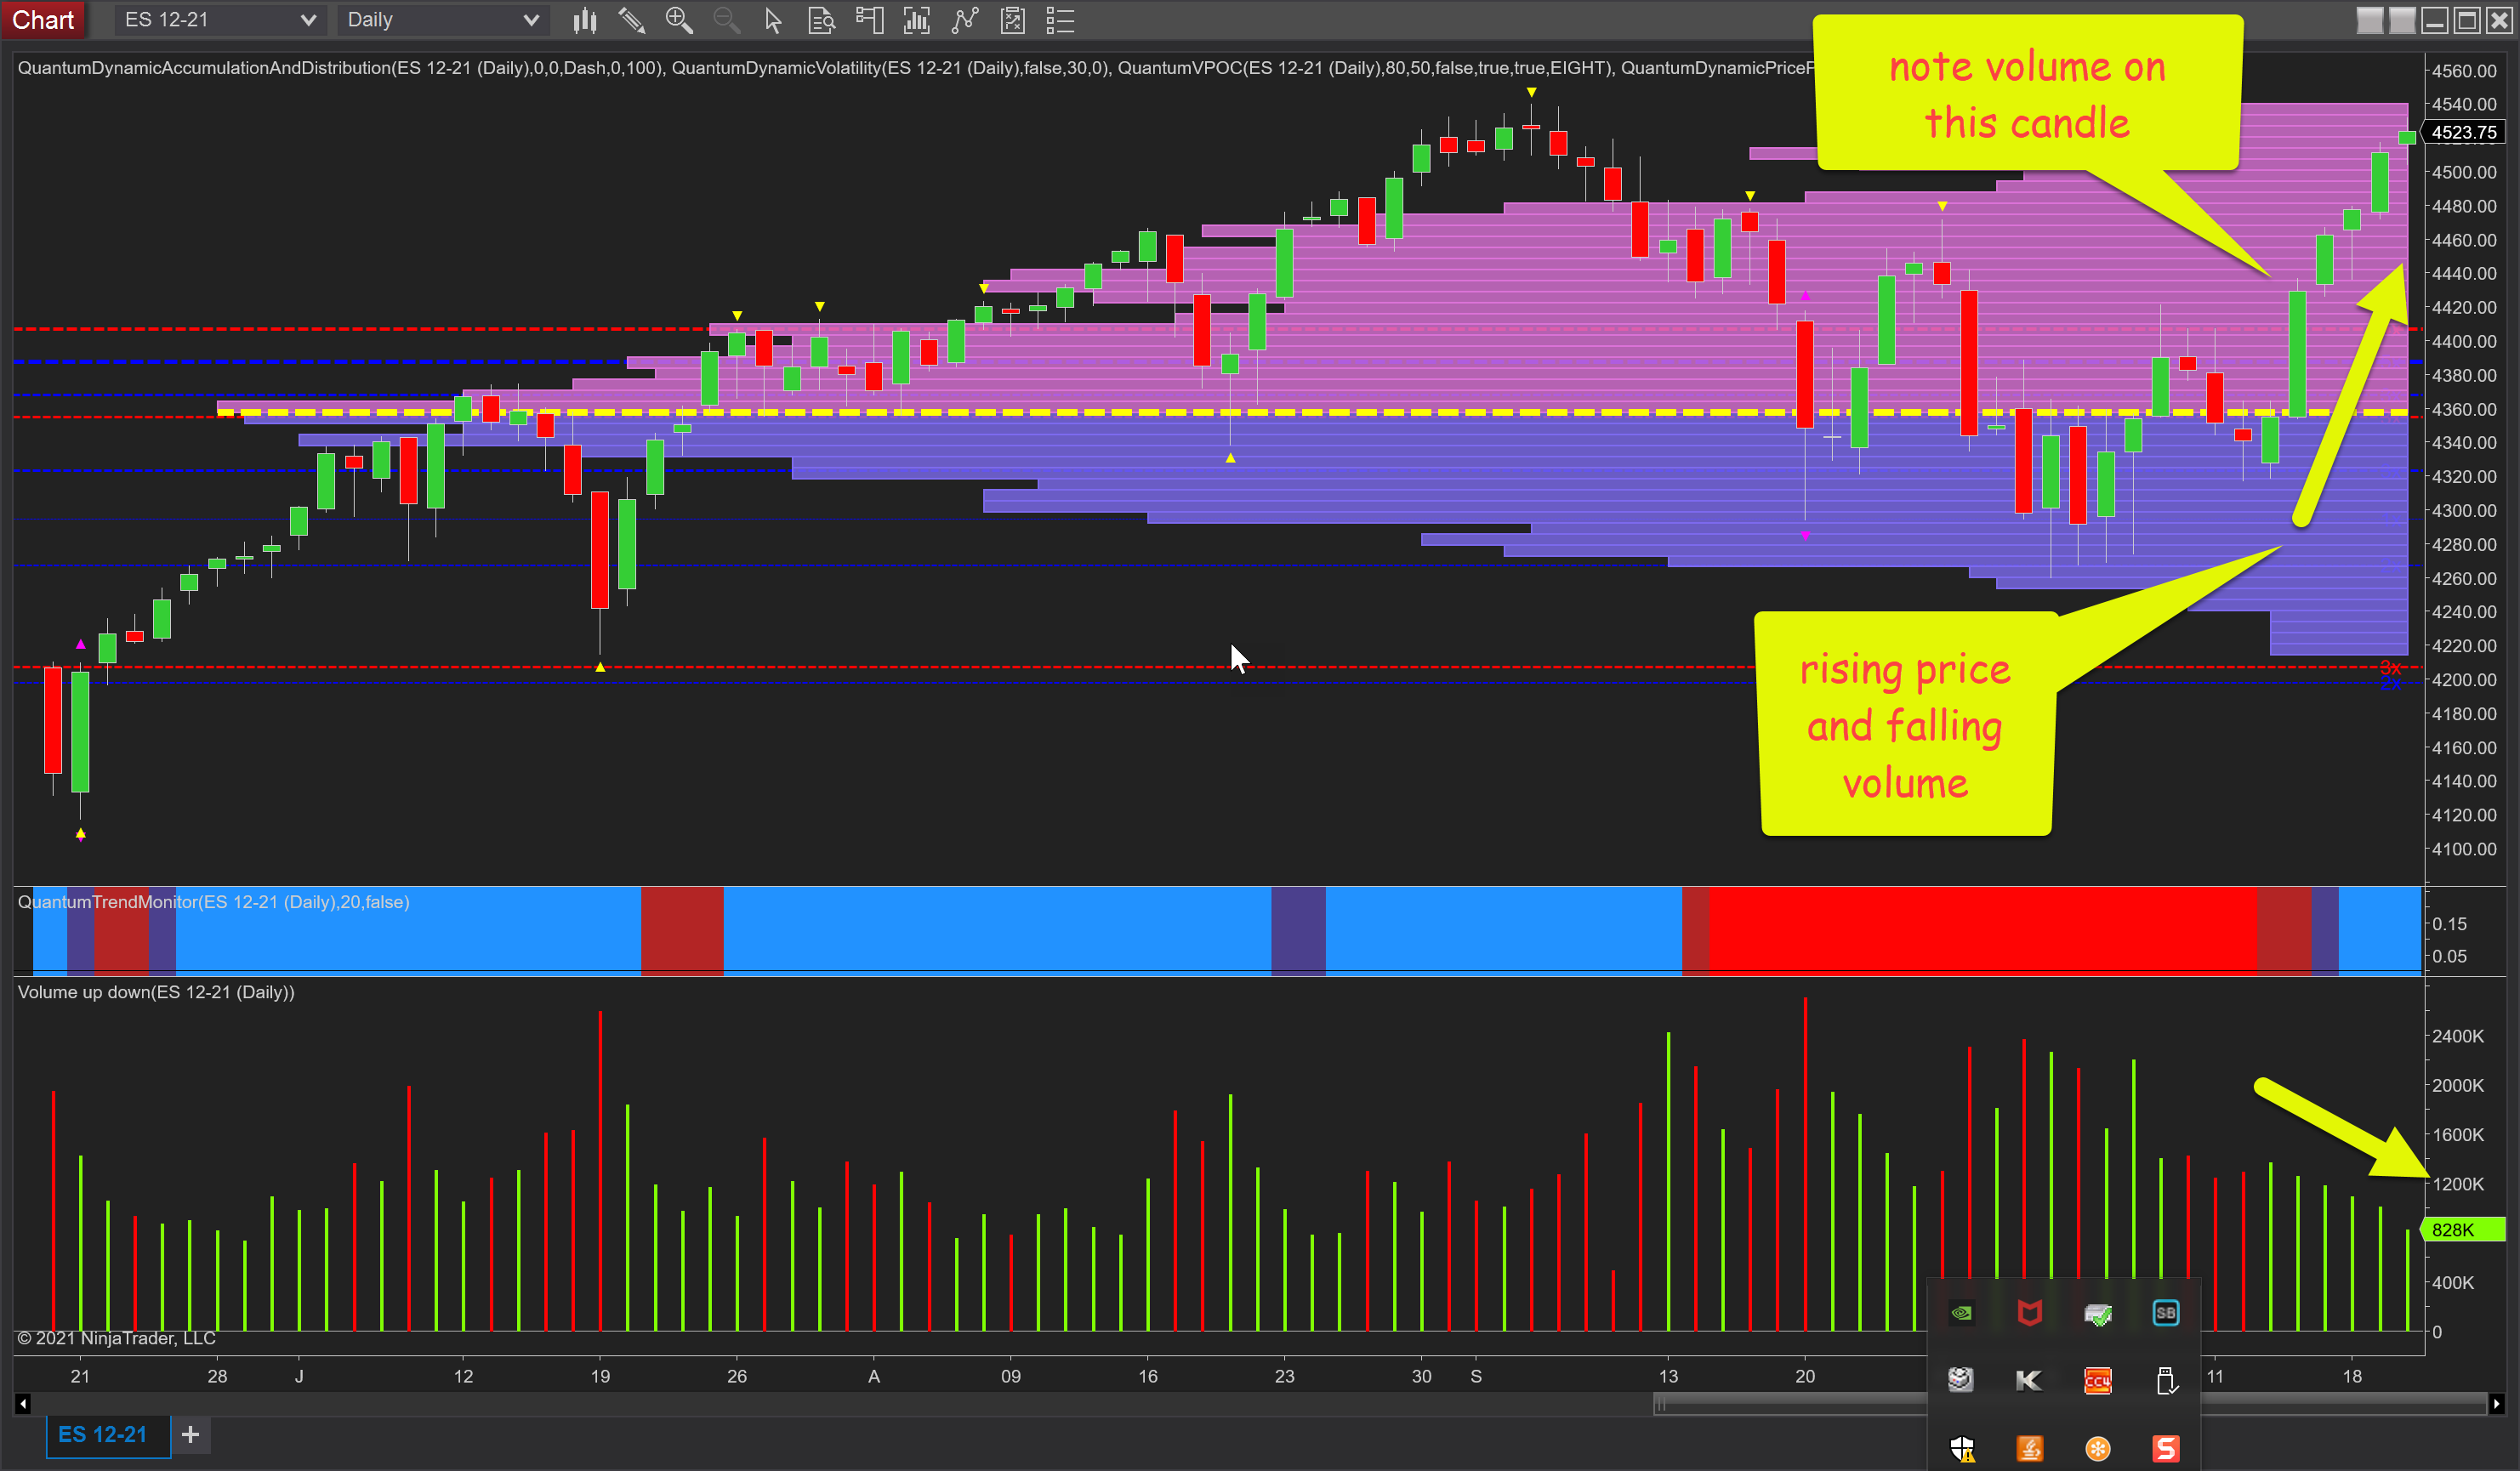
It’s been another day of gains for the ES Emini as we come towards the end of the Wednesday trading session, and no doubt longer-term investors will be relieved that bullish sentiment has returned after the roller coaster ride of the last few weeks, but for how much longer? And whilst I don’t wish to rain on anyone’s parade, the volume associated with the last six days is showing a worrying trend, and it’s not a positive trend either. As can clearly be seen, volume is declining while the price is ascending and as such presents a clear anomaly for Wyckoff students. For such a move we should expect to see volume rising and not falling. What also looks anomalous is the second of these candles for the price action of the 14th of October. Here we had a widespread up candle and yet the volume can only be described at best as above average perhaps and certainly not in agreement with the effort required to propel the market through this range. In other words, Wyckoff’s third law here of effort and result and of the two being in disagreement. It is also once again an example of benchmarking where we consider price and volume with other candles for comparison and confirmation. Finally, we are also approaching the previous top of late August at 4540 which triggered the reversal into September. So, in summary, enjoy the ride higher, but the warning flags are fluttering in the strengthening breeze.
(Click on image to enlarge)
Disclaimer: Futures, stocks, and spot currency trading have large potential rewards, but also large potential risk. You must be aware of the risks and be willing to accept them in order to invest in ...
more

