
Nonfarm payroll employment growth far exceeded consensus, at 339K vs 180K. With April’s monthly GDP from SPGMI, we have the following picture of indicators followed by the NBER BCDC (along with monthly GDP):
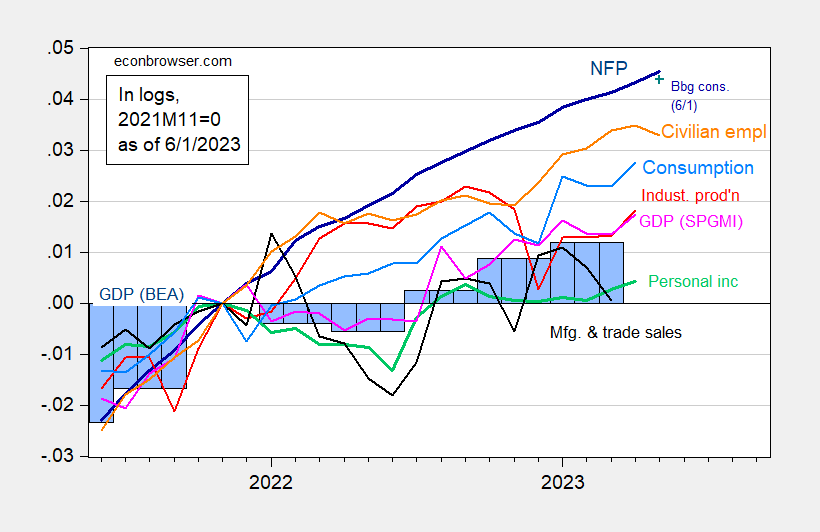
Figure 1: Nonfarm payroll employment, NFP (dark blue), Bloomberg consensus of 6/1 (blue +), civilian employment (orange), industrial production (red), personal income excluding transfers in Ch.2012$ (green), manufacturing and trade sales in Ch.2012$ (black), consumption in Ch.2012$ (light blue), and monthly GDP in Ch.2012$ (pink), GDP (blue bars), all log normalized to 2021M11=0. Bloomberg consensus level calculated by adding forecasted change to previous unrevised level of employment available at time of forecast. Source: BLS, Federal Reserve, BEA 2023Q1 2nd release via FRED, S&P Global/IHS Markit (nee Macroeconomic Advisers, IHS Markit) (6/1/2023 release), and author’s calculations.
Nonfarm payroll employment in the latest release exceeds the implied level partly because of the surprise on employment growth and upward revisions to previous months’ levels.
GDPNow (today’s release) for Q2 is 2.0% SAAR. So GDP growth seems to be maintaining momentum. However, as noted in this post, other measures of aggregate output have trended sideways or downward.
More By This Author:
Capture and Ideology, Debt Ceiling EditionAggregate Demand Vs. Income: Sometimes An Important Distinction
Conflicting Signals For Coincident Macro Indicators At End-May


Comments
Log in or sign up to join the conversation.