Aggregate Demand Vs. Income: Sometimes An Important Distinction
Going back to intro macro, remember when we quickly impose the equilibrium condition Y=AD? What does it mean that Y doesn’t equal AD? Here’s a quick reminder.
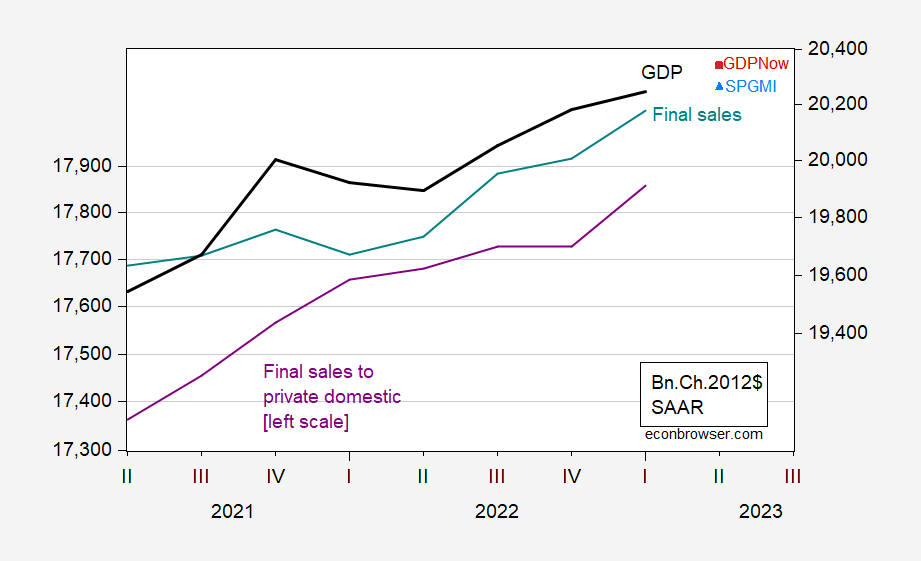
Aggregate Demand (AD) is typically measured by Final Sales. Income or output (Y) can be measured by the expenditure side or income side. The conventional picture is AD and GDE, shown in FIgure 1 below.
Figure 1: GDP (black, right log scale), final sales (teal, right log scale), final sales to private domestic purchasers (purple, left log scale), all in billions Ch.2012$ SAAR. Source: BEA 2023Q1 2nd release.
The difference is inventory accumulation/decumulation. If all the inventory change is desired, then final sales is a good measure of aggregate demand. The most recent reading indicates rapid growth for final sales, at 3.4% vs. 1.3% for GDP (SAAR). Final sales includes sales to foreign purchasers, and subtracts imports. A conjectured superior measure of domestic private demand is final sales to non-government domestic purchasers; this series is not necessarily more stable (the growth rate has a higher standard deviation than final sales). This series grew 2.9% in Q1.
Stressing Y (which can be measured in various ways) vs. final sales highlights that aggregate demand can deviate from income. As best we can tell, demand is still growing.
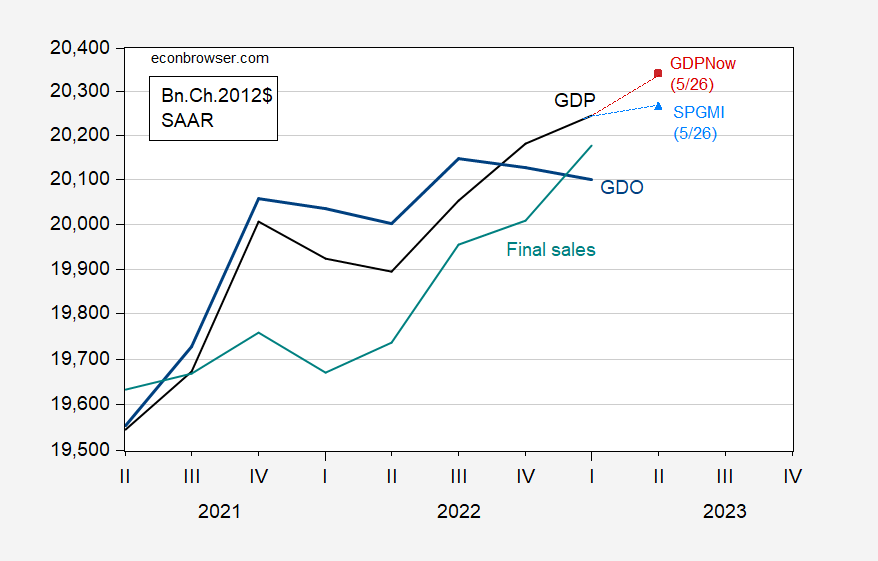
Figure 2: GDP (black), GDPNow (red square), SPGMI GDP tracking (sky blue triangle), GDO (bold blue), final sales (teal), all in bn. Ch.2012$ SAAR. Source: BEA 2023Q1 2nd release, Atlanta Fed, SPGMI.
If one literally believed GDO as output (see discussion here of GDO vs GDP+ vs GDP) and final sales as aggregate demand, then demand would seem to be strong. However, GDO (as the average of GDP and GDI) is not going to be constructed in a manner consistent with the calculation of final sales – after all, final sales is just Gross Domestic Expenditure (which we call GDP) minus inventory accumulation. If the biggest measurement error were in C, fixed I, and G, then one might think final sales looked more like GDO minus inventory investment.
As it is, inventory investment is a highly volatile component of GDP. Over the last business cycle (2009Q2-19Q4), the standard deviation of inventory accumulation was about the same as the standard deviation of GDP (in billions of Ch.2012$) – 60bn vs 62bn Ch.12$ SAAR. Unfortunately, I don’t know how big revisions to inventories are in recent times; the last study I found is Howrey (REstat 1984).
In any case, I think it useful to consider our best estimates of both output/income and aggregate demand, when thinking about where the economy is going.
More By This Author:
Conflicting Signals For Coincident Macro Indicators At End-MayPercent Vs. Percentage Points; Exponential Vs. Linear
X-Date Estimate – June 5 Or So?


