
This week we've had the Republican Convention whose outcome was the Trump-Vance ticket. Leading up to the convention there was the assassination attempt on candidate Trump's life. The market is lapping it all up and working hard to prove the maxim that July is the market's best month.

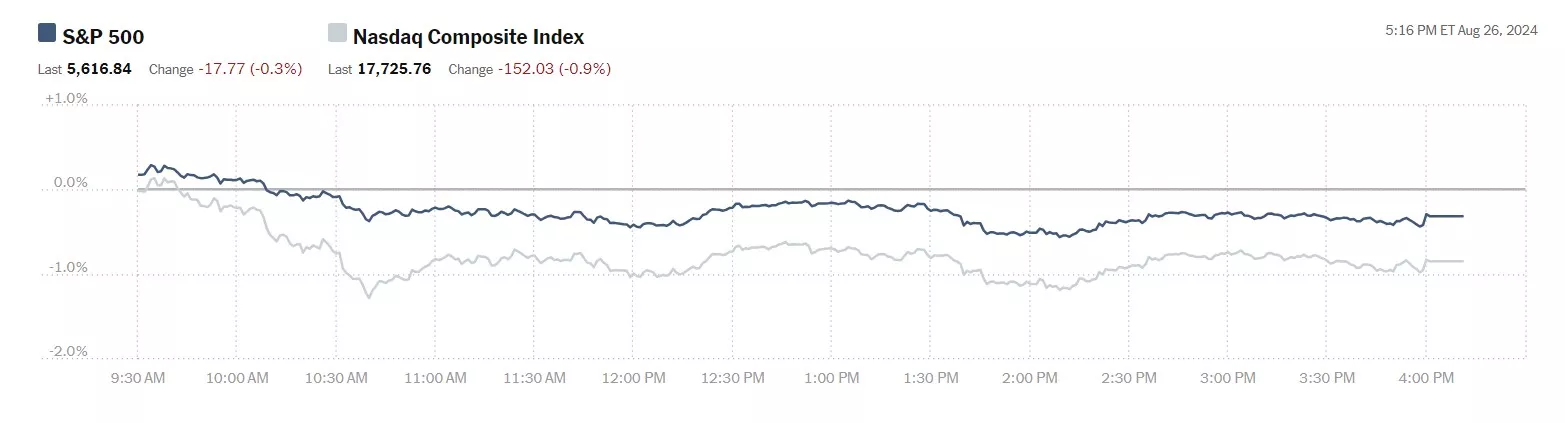
Yesterday's rally ended in an upwards boost. The S&P 500 closed at 5,667, up 36 points, the Dow closed at 40,954, up 743 points and the Nasdaq Composite closed at 18,509, up 37 points.
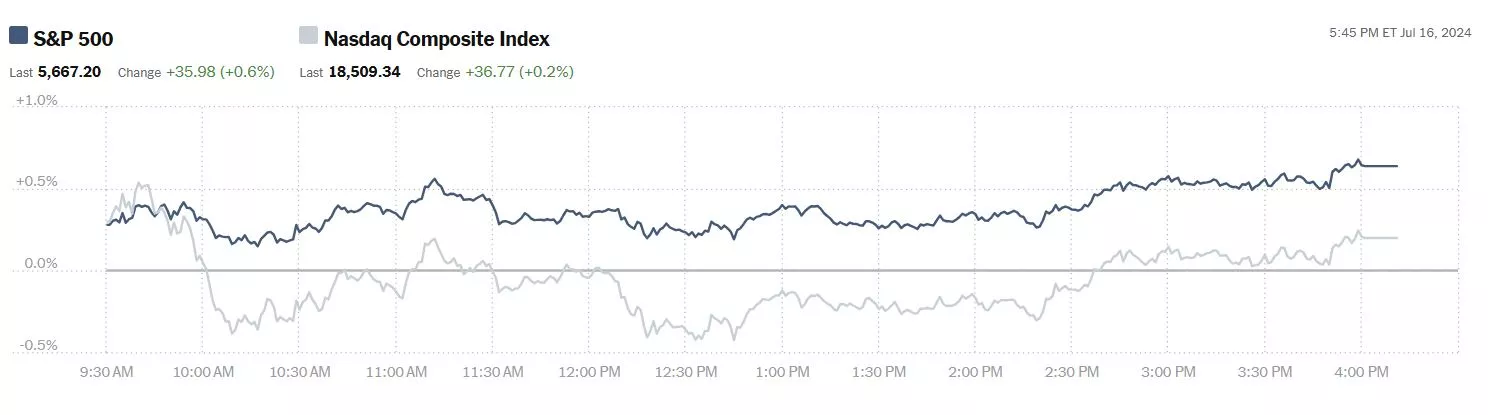
Chart: The New York Times
Most actives were led by Nvidia (NVDA), down 1.6%, followed by Tesla (TSLA), up 1.6% and Bank of America (BAC), up 5.3%.
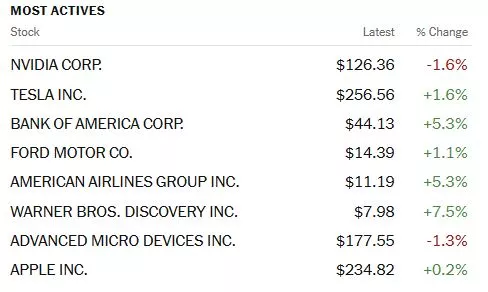
Chart: The New York Times
In morning futures trading S&P 500 market futures are down 57 points, Dow market futures are up 156 points and Nasdaq 100 market futures are down 447 points. Too much partying can give you a hangover the next day...
TalkMarkets contributors Lance Roberts and Michael Lebowitz, write that Goldman Sachs Makes A Case For A July Cut.
"Goldman Sachs has been vocal over the last week or two, making a good case for the Fed to cut rates as soon as the July 31st FOMC meeting. Goldman Sachs strategist Jan Hitzius was quoted as follows:
While September remains our baseline, we see a solid rationale for already cutting in July. If the case for a cut is clear, why wait another seven weeks before delivering it?
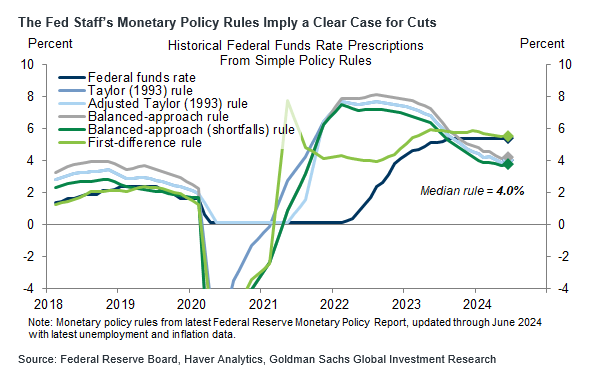
The graph below also from Goldman Sachs shows that many monetary policy rules the Fed tracks imply that Fed Funds are, on average, about 1.25-1.50% too high. Moody’s seems to agree with Goldman Sachs. In a recent statement, they say:
The Fed could begin policy easing with a 25 basis point cut as early as in the upcoming 30-31 July meeting.
While we believe there is a good case for rate cuts, it still appears the Fed wants to wait for more economic data. Thus, a September hike is the most likely date for the first rate cut. However, history shows the Fed can change its mind quickly. In June 2019, the Fed said it would not cut rates until 2020. They lowered the Fed Funds rate in the following month (July)."
Contributor Ironman notes the Job Market For Teens Not Exactly Booming In Summer 2024.
"If you pay attention to the job trends for American teens and listen to National Public Radio's Marketplace, you might be in for a bit of a shock. According to this authoritative source, teen summer employment is "still booming".
By that, they mean the percentage of the teen population Age 16-19 that is either working or looking for a job is on a rising trend and has reached a relatively high level after having fallen for decades.
There's just one problem. To make that claim, they're including teens that aren't actually employed in their measure. They're counting unemployed teens who don't have jobs as if they do.
Here's the actual claim:
In June, 37.4% of 16-to-19-year-olds were either working or looking for a job, according to the latest jobs report. That’s just shy of a 15-year high of 38% back in March.
Here's the problem. When you title an article with a headline like "Teen summer employment is still booming", the readers of that article are going to reasonably expect that you're reporting on the number of teens who are employed. If you're including the percentage of teens who do not have jobs but are looking for work in the figures you are reporting, you're not really describing how successful teens are at getting jobs.
What you're really describing is the size of the teen labor force. By definition, the teen labor force includes both the number of teens who have a job and the number of unemployed teens who do not but are trying to get one. And if you do that, what you're not describing is how successful teens have been in getting employed.
What does the employment situation for teens look like when you only look at the ones who actually have jobs? Here's the latest update to our charts tracking the employment of working age U.S. teenagers (Age 16-19) in the U.S. from January 2016 through June 2024. The top chart shows the seasonally adjusted employment numbers for the entire Age 16-19 population and also the demographic subgroups of younger working teens Age 16-17 and older working teens (Age 18-19). The bottom chart shows the employment-to-population percentage for each of these demographic groups:

When we do that, we find nothing especially special about 2024's summer teen employment situation. The seasonally adjusted data shows the combined total of Age 16-19 teens with jobs declined a small amount from May 2024's level. The subgroup data indicates that reported decline came mainly among older teens (Age 18-19), as the number of younger teens (Age 16-17) with jobs increased over the previous month.
The upper chart shows the rising for teen employment have been rising during most of the post-pandemic recession era, but the next chart showing the seasonally adjusted U.S. teen employment to population ratio shows teen employment isn't really booming at all.
Instead, it shows the percentage of the U.S. working age teen population who have successfully obtained jobs peaked between December 2022 and April 2023 depending on the particular age group. June 2024's data for each of the groups we track is below those peaks. This chart confirms the actual teen employment boom, such as it was, peaked in late 2022 and early 2023. If summer teen jobs were "still booming", we'd see a rising trend in 2024 in this seasonally-adjusted data, particularly during the summer months.
It's not a bad job market for teens. It's just not a "still booming" one. It hasn't been for over a year. Perhaps that will change as we get further into Summer 2024, but right now, the data is saying otherwise."
TM contributor Michael Lebowitz is on a roll, he calls out Irrational Exuberance Then And Now.
"On December 5, 1996, Chairman of the Fed Alan Greenspan offered that stock prices may be too high, thus risking a correction that could result in an economic fallout. He wondered out loud if the market had reached a state of “irrational exuberance.”
Over the past few months, we have seen the same term, irrational exuberance, used to describe the current state of the stock market. To gain perspective on the future, let’s compare the market environment that prompted Greenspan’s comments to today.
Irrational Exuberance
Clearly, sustained low inflation implies less uncertainty about the future, and lower risk premiums imply higher prices of stocks and other earning assets. We can see that in the inverse relationship exhibited by price/earnings ratios and the rate of inflation in the past. But how do we know when irrational exuberance has unduly escalated asset values, which then become subject to unexpected and prolonged contractions as they have in Japan over the past decade? And how do we factor that assessment into monetary policy? We as central bankers need not be concerned if a collapsing financial asset bubble does not threaten to impair the real economy, its production, jobs, and price stability. Indeed, the sharp stock market break of 1987 had few negative consequences for the economy. But we should not underestimate or become complacent about the complexity of the interactions of asset markets and the economy. Thus, evaluating shifts in balance sheets generally, and in asset prices particularly, must be an integral part of the development of monetary policy. –Alan Greenspan December 1996
The simple translation: Greenspan was apprehensive due to high stock valuations; therefore, a correction of stock prices could damage the economy. He didn’t want to be “complacent about the complexity of the interactions of asset markets and the economy.”
Let’s review a few graphs to appreciate Greenspan’s point of view.
In just two years, between 1994 and the day Greenspan uttered irrational exuberance, the S&P 500 had risen nearly 60%. Furthermore, from the 1990 recession trough to his speech, the S&P had climbed almost 250%.
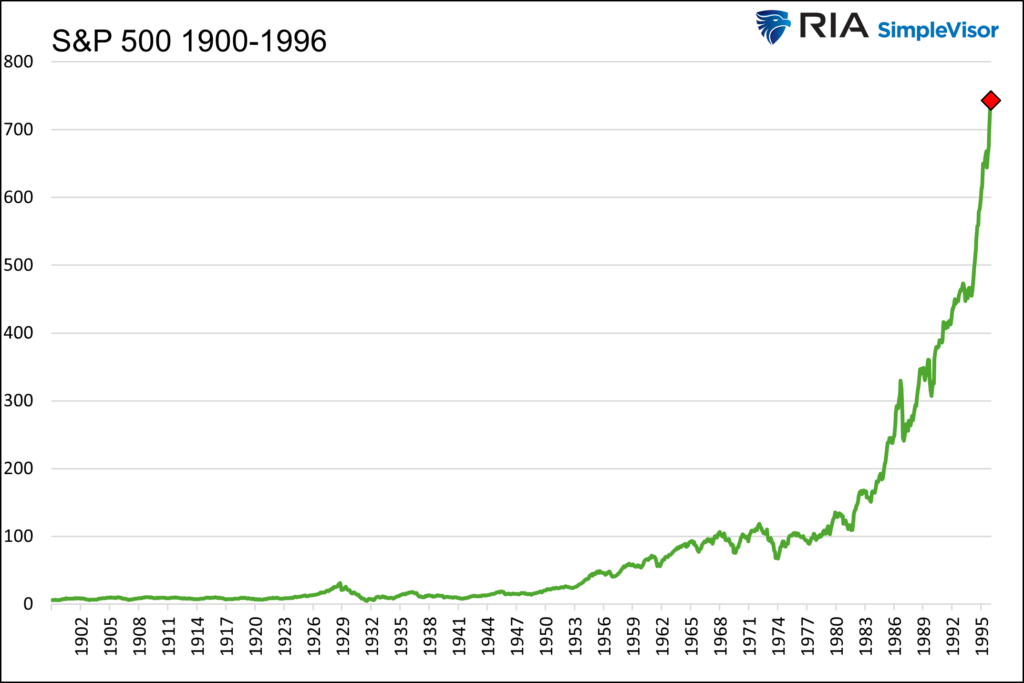
The economic recovery from the recession of 1990 kicked off the bull market. Further fueling the run were fabulous projections of how the budding World Wide Web, computers, and the powers of modern technology would result in outsized corporate profits and economic growth. Sound familiar?...
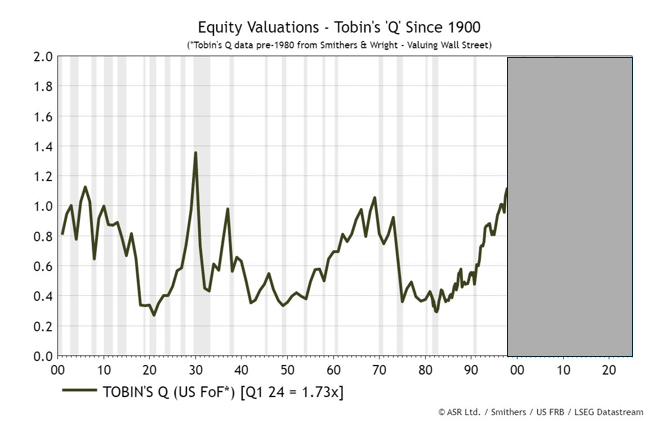
Another valuation metric, Tobin’s Q ratio, uses a company’s assets’ market value and replacement value to determine if a stock is over or undervalued. A ratio greater than one means the market values the company more than the value of its assets. Therefore, a high reading implies expectations for above-average earnings growth. As shown, in 1996, the ratio was slightly higher than the Nifty Fifty Bubble peak but below the 1929 peak.
Was Greenspan Prescient?
Greenspan had ample reason to worry with higher stock prices and valuations at levels seen near the tops of the last two stock booms. His warning caused the market to stutter for a few weeks before continuing its climb higher. Between December 5, 1996, and the bull market peak three years later, in 2000, the S&P more than doubled, and its valuations far exceeded the lofty levels of 1996.
Keep in mind that despite Greenspan’s weariness of market conditions, he cut rates by 75 basis points in late 1998 over concerns related to the Long Term Capital Hedge Fund bankruptcy. His actions further fueled the market significantly higher."
Sound interesting? There's more where this came from in the full article.
Contributor Stephen Innes looks at Federal Reserve Easing Vs. The Impact Of The Trump Trade.
"Apart from those trading in JPY today, FX traders find themselves in a deadlock, caught in the tug-of-war between the Federal Reserve easing and the Trump Trade.

Despite the uptick in U.S. real retail sales, there's a consensus that the retail sector faces potential headwinds. Factors such as tempered consumer spending growth, moderate inflation, and rising unemployment rates are expected to shape the future. This outlook continues to support the narrative of anticipated lower Fed rates...
The dollar's resilience, despite increasing dovish bets, can be attributed to the emergence of “hedges” against higher inflation, tariffs, and geopolitical risks, especially as a Trump re-election appears more likely after the weekend incident.
So, after the initial algorithm-driven knee-jerk reaction to buy the dollar, interbank voice desks were quick to counter the move...
Gold's relentless climb to new heights continued as investors bet heavily on a Fed rate cut, fueled by signs of slowing inflation and compounded by lackluster economic indicators. In a worrying trend, U.S. car repos surged 23% year-on-year in the first half of 2024, surpassing 2019 levels by 14%, underscoring growing consumer financial strain. This backdrop is bolstering expectations that policymakers will loosen monetary policy.
Adding to the gold rush, there's mounting anticipation of Donald Trump reclaiming the White House, which could further buoy precious metals amidst geopolitical uncertainty—a hedge against economic instability, like the Asian demand during trade wars..."
TalkMarkets contributor Dmytro Spilka closes out today's column with a look at Why Amazon’s Newfound $2 Trillion Market Cap Is Just The Start For The AI Boom’s Forgotten Tech Giant.
"Amazon’s (AMZN) growth has been extraordinary in recent years. After going public in 1997, AMZN waited 21 years to reach a $1 trillion market capitalization in 2018. Just six years on, the stock has reached $2 trillion, and given the rapid emergence of generative AI, it seems that the wait until $3 trillion may be even shorter.
Given that the stock rallied almost 30% over the first half of 2024, Amazon’s path to $3 trillion could be a short one. But what’s pushing AMZN higher? And can investors capitalize on the firm’s extraordinary growth?...

Amazon is a market leader in cloud computing, and much of the company’s revenue stems from the sector. In its Q1 2023 earnings, Amazon’s net sales rallied 13% to 143.3 billion alongside an operating income of $10.4 billion.
For the second quarter, Amazon is seeking to boost its sales to between $144 billion and $149 billion, alongside an operating income between $10 to $14 billion.
Given that the firm is intent on continuing to build on its impressive Q1 performance in 2024, it’s unsurprising that Jefferies analyst Brent Thill recently upgraded the stock’s price target, with at least 18% upside forecasted...
Generative AI is forecasted to become a $1.3 trillion market by 2032, and this presents plenty of opportunity for Wall Street’s leading tech players.
Amazon is already seeking to stake a major claim to become one of the world’s largest AI innovators, and has committed up to $230 million to support startups building generative AI applications.
The investment will see $80 million reserved for funding Amazon’s second AWS Generative AI Accelerator program, which will offer cloud-based infrastructure for startups building generative AI models as a core part of their operations...
Crucially, Amazon’s journey to a $3 trillion market cap and beyond will be supported by more widespread profitability both domestically and at an international level...
Amazon is banking on the vast potential of generative AI, and is set to continue reaping the rewards of its strategy in its bottom line."
That's a wrap.
Peace.

More By This Author:
Thoughts For Thursday: Fed Expectations Continue To Push Market Higher
Tuesday Talk: Bitcoin And Boeing
Thoughts For Thursday: Fireworks - Fourth of July and A.I.

Comments
Log in or sign up to join the conversation.