
Tuesday Talk: The Moose In The Room
With a nod to the Fed's summer confab in Jackson Hole I've replaced elephant with moose, but after being buried by a slew of good earnings reports, it's (inflation) still in the room.

As if being abruptly wakened from a surreal reverie, the market moved sharply downward yesterday, leaving nearly all its month to date gains in a messy pile on the floor.
The S&P 500 closed at 4,138 on Monday, down 2.14% or 90 points, the Dow closed at 33,064, down 1.91% or 643 points and the Nasdaq Composite closed at 12,382, down 2.55% or 324 points.
Most actives were all down, several were Technology issues.

Chart: The New York Times
With confidence being held hostage by The Fed and by Putin, all eyes will be on Jerome Powell on Friday when he speaks at the Fed's Jackson Hole symposium. In the meantime, the market may be looking to come up for air this morning as market futures have just turned green in early morning trading. S&P market futures are up 2 points, Dow market futures are up 20 points and Nasdaq 100 market futures are up 5 points.
TalkMarkets contributor New Deal Democrat zeroes in on The State Of Inflation with a look at 3 key drivers and confirms that we need to keep braced.
"Three of the biggest components of inflation have been gas, housing, and vehicles. Let’s look at each in that order.
According to GasBuddy, average US prices as of today are $3.86/gallon:

As the above graph shows, that means that almost 80% of the Ukraine war premium in prices has been deflated.
Although we’re only 2/3’s of the way through the month, here’s what the monthly inflation correlation looks like so far:

In the above graph, I’ve divided the change in gas price by 16, roughly in equivalent scale to total inflation. Because these is about a +.15% underlying bias to core inflation, I’ve subtracted that for a better correlation. Based on that, actual inflation in August looks unlikely. Another month of unchanged prices, if not outright deflation for the month appears likely."
Good news, but...
"Turning to housing, here’s the graph I ran several weeks ago of the latest FHFA and Case Shiller house price indexes through May, vs. owner’s equivalent rent, how the Census Bureau measures housing in the CPI:

Because OER (owner's equivalent rent) lags actual house prices, increases in which so far have not decelerated significantly in those indexes, we can expect monthly OER increases in line with the +.5% or +.6% of last few months, if not even slightly higher, as shown in the graph below:

Finally, let’s turn to vehicles. Used car prices started to increase sharply in spring 2021, and are now 50% higher than they were just before the pandemic. The good news there is that seasonally adjusted prices (black in the graph below) are no higher than they were 8 months ago, in December of last year:
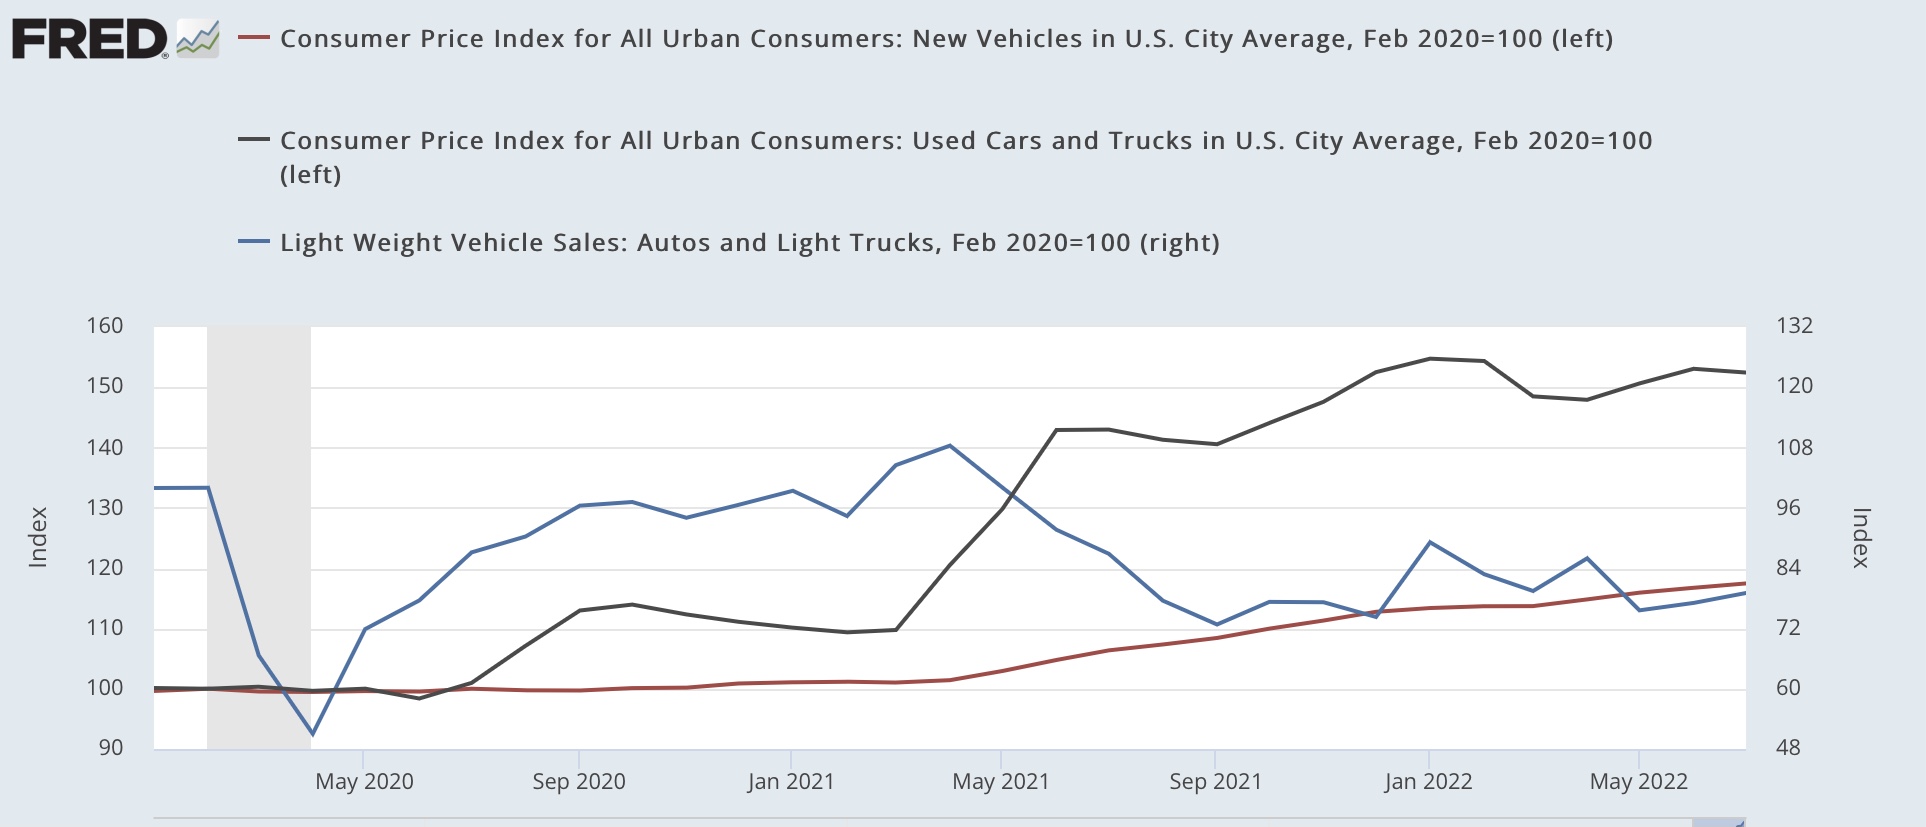
New car prices (red) started to appreciate sharply several months after used car prices, and are now 18% higher than just before the pandemic. Further, in the past year, they have increased by at least .6% in every month except for last winter.
As you might expect, new vehicle sales (blue, right scale above) have declined sharply (about 25%) in response to the big price increases.
Via Wolf Street, according to Cox Automotive vehicles in stock and in transit to dealers is still 70% below what it was just before the pandemic...
In short, there is no sign of any abatement in inflation either in housing or new vehicles. The decline in gas prices should result in another good consumer price reading for August."
Contributor Taki Tsaklanos asks Is Apple About To Lead The S&P 500 And Nasdaq Lower In September?

Apple (AAPL) is the largest stock in the S&P 500 (SPX) and the Nasdaq (NDX)...There are some really relevant insights to be derived from Apple’s chart structures.
The findings that are worth thinking about:
- There is resistance, double resistance, at current levels. Apple fell below its rising channel back in May, turned lower in May/June and staged a big rally in July/August. The rally stalled right at the rising channel which coincides with a resistance line that connects the 2022 highs.
- The support level that will be tested is 151-156 USD. That’s a 12% pullback. This will drive both the Nasdaq and the S&P 500 lower with at least a 6 to 8 pct. impact. Ultimately, 140 USD should hold, is what we are thinking.

"It gets more interesting when looking for ongoing chart structures that will define new trends. In that respect, we see the following:
- The period April till August marked a really big reversal. It took some 2.5 months from top to bottom and some 1.5 month from bottom to top.
- Consequently, we can reasonably expect the market to create the 2nd part of the ongoing chart structure, in the coming 2 to 3 months. We expect a similar reversal but with a higher low against June.
- IF our expectation is right, we can reasonably conclude that 2022 was a base building year, characterized by violent swings (in both directions). This sets the stage for a major breakout and bullish trend in 2023.
- IF our expectation is wrong, we will see a major and bearish M-pattern in 2022."
See the full article for additional commentary.
Two TM contributors have looked at the July data and concluded that the US economy is not in recession.
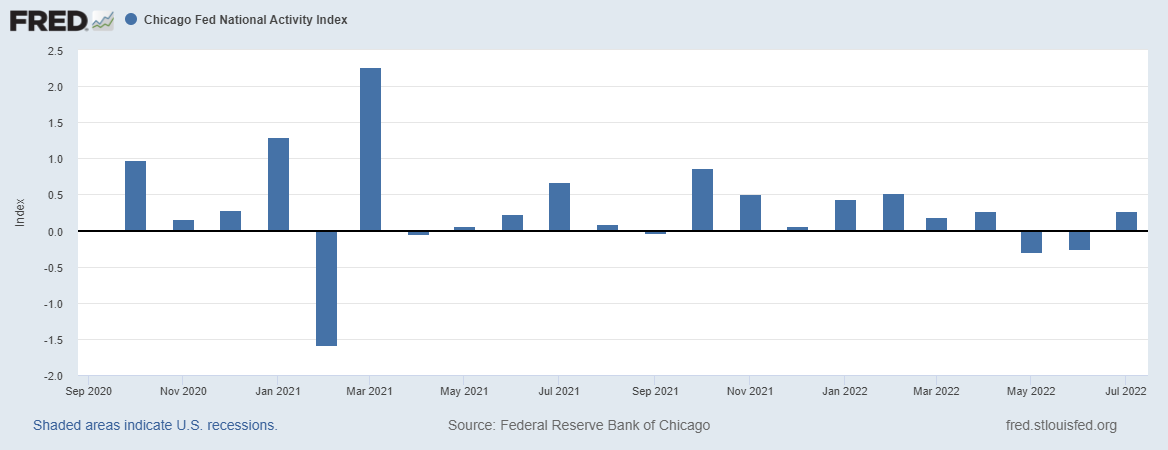
Economist Menzie Chinn looked at the Chicago Fed National Activity Index and quashes the quip So You Think We’re In A Recession As Of July?
Chinn includes several charts based on CFNAI data to show that the economy is continuing to grow (thru July). The charts are relatively easy to understand so it is definitely worth peeking at the full article, but I have posted his diffusion index chart below:
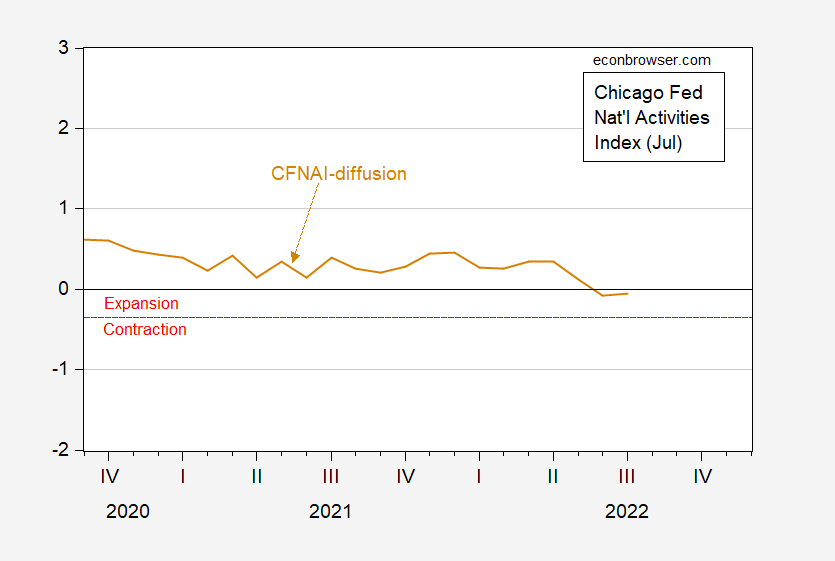
Figure 3: CFNAI diffusion (tan). Below red dashed line indicates contraction, above indicates expansion. Source: Chicago Fed, July release.
"The diffusion index is above the level consistent with contraction, after a period of expansion. This measure also works pretty well, with the exception of signaling a recession start in December 2000 rather than the NBER contraction starting in April 2001. Hence, the CFNAI, a weighted average of 85 indicators of economic activity (described here), suggests we are not as of July 2022, nor have we within the past year, been in a recession."
Joseph Calhoun found that The Economy Improved In July.
"I know it is trendy to see the US economy as heading for or in recession but the data just doesn’t agree. I am not unaware of the risks and if I had to guess I’d say we will have a recession, probably starting in the first half of next year which is when futures markets indicate rates are likely to peak...Bond markets are generally where we look for evidence of future economic activity. Right now, rates are in an uptrend, credit spreads have narrowed from their worst levels and the yield curves are steepening (slightly) in a good way – long rates rising faster than short rates. That would seem to support the idea that economic activity bottomed in Q2.
Does that mean it can’t or won’t get worse going into the end of the year? Of course not, but we aren’t in recession right now and the data is actually pointing to an improvement.
Along with his daily stocks and metals charts contributor Jesse in his article Ashes, Ashes, We All Fall Down includes this zinger aimed at the Fed Chair:
"All eyes and ears will be on Powell at Jackson Hole this Friday.
Why? Because although we are probably at après-bubble peak, the Fed still has the juice to keep it going or let it slide, at least for now.
At some point, an exogenous event will probably take their favorite toy away from the Banksters."
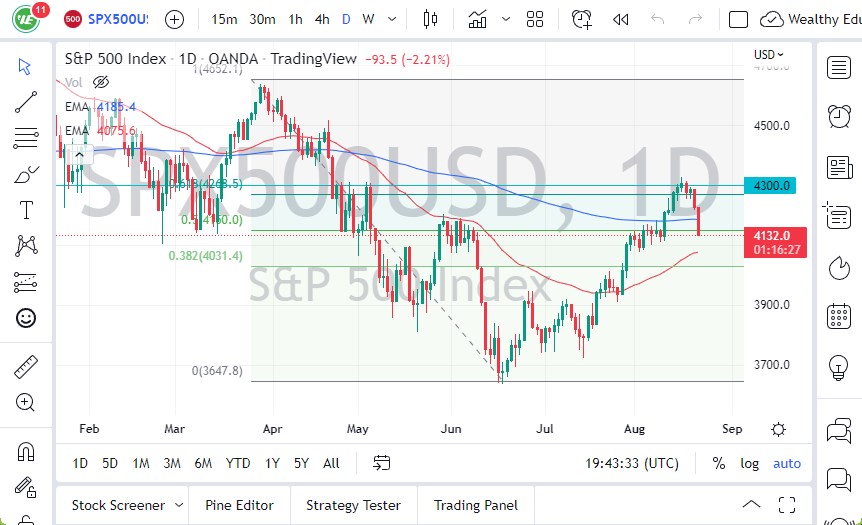
TM Contributor Christopher Lewis' S&P 500 Forecast: Looking At Noisy Behavior for today is this:
"...the market is likely to continue being a bit skittish, and it is probably worth noting that we are sitting right on a “ledge” that had formed previously in the form of the 4135 if we break through this area, that could be the beginning of a rather significant selloff.
If we rally from here, the 200-Day EMA is an area that I think a lot of people would pay close attention to, because it is a rather bullish thing to overcome. At that point, the market is likely to look into the 4300 level. I don’t necessarily think that’s going to happen easily, and I would fully anticipate that the Jackson Hole Symposium is a long litany of central bankers going on about how they need to tighten monetary policy. In other words, we may have seen the top of the rally. However, we do not know what happens until it happens."
Before closing out the column for today contributor Iris Pang informs us that Chinese Banks Cut Long Term Loan Prime Rate Aggressively, in an effort to help the decimated housing market. If the US housing market is currently "sneezing", China's without question, has a full-fledged cold in need of strong medicine.
"It was surprising that banks only cut the 1Y loan prime rate by 5bp this month. It could be that banks chose to leave rate-cut room for long-term loans, and instead, cut 15bp from the 5Y loan prime rate.
Most home mortgages are linked to the 5Y loan prime rate. So this rate cut is obviously to reduce the burden on borrowers.
At the same time, some local governments have started to lend to property developers to continue the construction of uncompleted homes. The two measures together should reduce the concern of existing home mortgage borrowers.
We expect there will be at least one more 5Y loan prime rate cut in 2022. When the market sees progress in the construction of uncompleted projects, we may see an improvement in home buying sentiment and home prices should stabilize."

"(Overall), we think residential construction activity in China will contract in 2022."
Have a good one and enjoy this song from The Moose Whisperers.

More By This Author:
TalkMarkets Image Library
Thoughts For Thursday: Back To The Races
Tuesday Talk: Gone Fishing Till Wednesday?


