
CFNAI edition – from Chicago Fed today:
Index Points to a Pickup in Economic Growth in July
The Chicago Fed National Activity Index (CFNAI) was +0.27 in July, up from –0.25 in June.
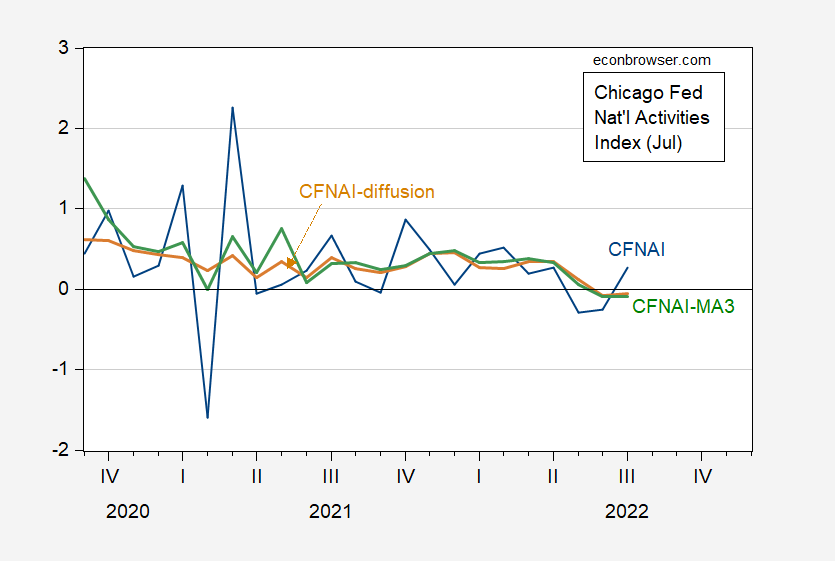
Figure 1: CFNAI, in standard deviation units (blue), CFNAI 3-month moving average (green), and CFNAI diffusion (tan). CFNAI normalized at 0 for trend growth rate. Source: Chicago Fed, July release.
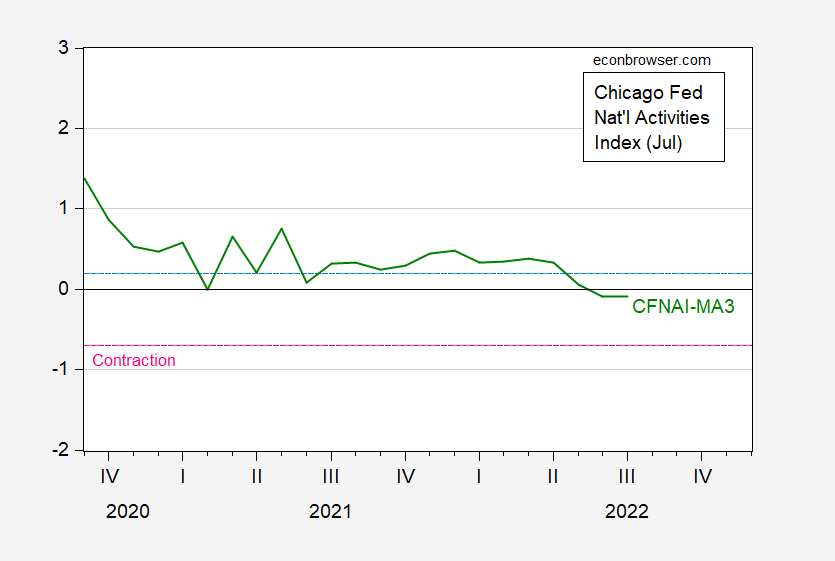
Figure 2: CFNAI 3 month moving average (green). Pink dashed line indicates level at which reading after period of expansion indicates contraction. Source: Chicago Fed, July release.
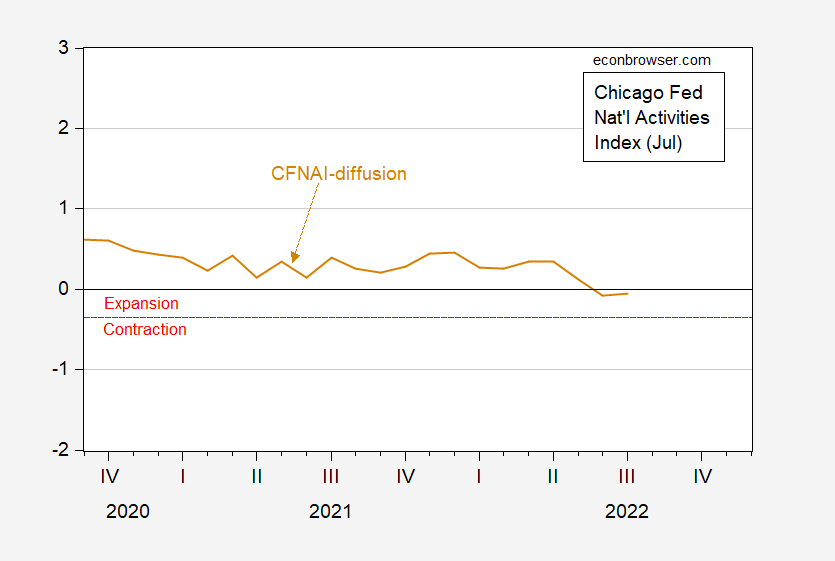
Figure 3: CFNAI diffusion (tan). Below red dashed line indicates contraction, above indicates expansion. Source: Chicago Fed, July release.
The three-month trailing moving average is slightly under zero, indicating growth slightly below historical trend growth. It is far above the level consistent with contraction (i.e., recession). The CFNAI-MA3 tracks pretty well with NBER defined recessions (see the Chicago Fed website for the requisite graphs), except for the 2007 recession, where the CFNAI-MA3 passes the threshold in April 2008 (rather than Jan 2008, the month after the NBER defined peak).
The diffusion index is also above the level consistent with contraction, after a period of expansion. This measure also works pretty well, with the exception of signaling a recession start in December 2000 rather than the NBER contraction starting in April 2001.
Hence, the CFNAI, a weighted average of 85 indicators of economic activity (described here), suggests we are not as of July 2022, nor have we within the past year, been in a recession.
I might note that for weekly data through August 13th, it’s not looking good for the recession call either, as noted in this post.
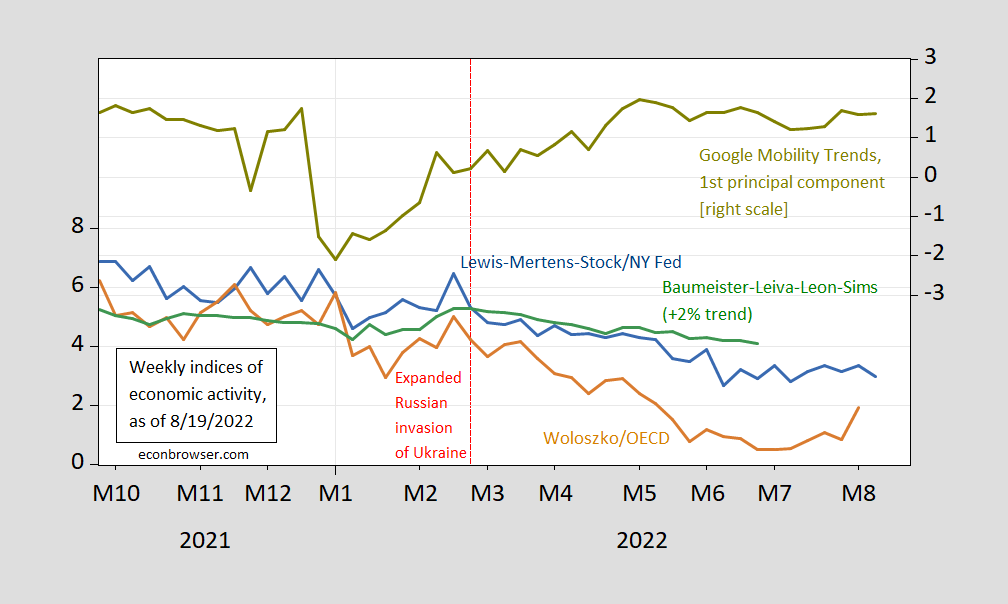
Figure 4: Lewis-Mertens-Stock Weekly Economic Index (blue, left scale), OECD Weekly Tracker (tan, leftt scale), Baumeister-Leiva-Leon-Sims Weekly Economic Conditions Index for US plus 2% trend (green, left scale), first principal component of Google Mobility Trends (chartreuse, right scale). Source: NY Fed via FRED, OECD, WECI, Google and author’s calculations.
(A follow up on “So you think we might be in a recession today” Part I, Part II, Part III, Part IV, Part V, Part VI, as well as “So you think we might be in recession as of mid-June”, Part I and Part II, and “So you think we might be in a recession as of mid-July”, and “So you think we might be in a recession as of end-July”)
More By This Author:
Bank Loan GrowthRetail Sales, Inflation Adjusted
Looking Back At Q2


Comments
Log in or sign up to join the conversation.