
Tuesday Talk: Gone Fishing Till Wednesday?
Though the market started out higher on Monday, it ended the day more or less where it began. Perhaps it's just a case of gone fishing till Wednesday, when the July CPI figures will be released.

It is August after all and with the House version of the Inflation Reduction Act of 2022 pending passage, no progress in ending the war in Ukraine and Iran being served a best and final by the West in the current round of negotiations, lack of immediate direction is certainly a probable outcome.
Yesterday the S&P 500 closed at 4,140, down 5 points, the Dow Jones Industrial Average closed at 32,833, up 29 points and the Nasdaq Composite closed at 12,644, down 13 points.

Chart: The New York Times
Currently market futures are trading flat to green. S&P 500 market futures are up 5 points, Dow market futures are up 60 points and Nasdaq 100 futures are down less than 1 point.
TalkMarkets contributor Roberto Rivero writes: Wall Street Flat As Investors Eye Important Inflation Data.
"Two weeks ago, the US Bureau of Economic Analysis (BEA) announced a second consecutive quarter of negative growth but stopped short of labeling this latest contraction as a recession...Consequently, all eyes turned to the release of last Friday’s nonfarm payroll...US job growth surged in July, with 528,000 jobs added versus the 250,000 which had been forecast. This better-than-expected result lent credence to the BEA’s position and poured cold water on concerns that rising interest rates and high inflation were softening labor demand in the US.
July’s strong job data has consequently fueled expectations that the Fed will press ahead with aggressively tackling inflation. Investors now await the latest inflation figures on Wednesday for an indication of the Fed’s next move, and traders should brace themselves for increased volatility in the US markets around its release.
Subsequently, although Wall Street opened higher on Monday, the markets remained mostly flat amidst increased caution from investors."

Rivian Pick-up in the desert - Unsplash
"Despite the indecision on display in the major indices, many electric vehicles and renewable energy stocks posted gains yesterday, after the US Senate passed the climate, energy, and health care bill over the weekend.
The bill, which allocates around $370 billion to reducing greenhouse gas emissions and investing in renewable energy sources, will now make its way to the House of Representatives for further approval. First Solar (FSLR), Bloom Energy (BE), and Rivian Automotives (RIVN) were three stocks that benefitted from the news, ending the session with gains of 4.75%, 4.36%, and 6.78% respectively."
Contributor Bob Lang says Despite Positive Signs, We Are Still In A Bear Market.
"Bear markets sure are exhausting. The economy and markets have flashed positive signs lately, but make no mistake – we are still in a bear market.
I want this bear market to be over, too – trust me! Knowing that a new bull market lies on the other side of “bear mountain” has all of us anxious...
The markets have roared back from deep lows in June and they are now up 14% or more in just seven weeks. That is quite the move higher, and it has been dragged out with dripping volatility...Sentiment is starting to turn bullish, but the wall of worry is up – way up."

"This is still a bear market, and it’s still easy to lose money on trades. Wait until a new bullish trend is established before jumping in feet first. It’s not easy to wait for the right pitch to come across the plate before taking a swing, but it’s the best way to win at this crazy game called trading."
In an Editor's Choice article, contributor Douglas Gammons pegs the current action in the market as Still In A Short-Term Uptrend. Doug views the market through charts and there are a barrage of them in his article. Below are a few of the charts whose plots he is mining.
"The market is still in a short-term uptrend, and nothing seems to be able to knock it off course.
The chart below is a look at the SPX and the NYSE Summation Index. The chart shows the SPX above its 50-day, and it shows that the 50-day is starting to curl upwards. That's bullish behavior, but then you see the index is still well below the 200-day and stalling a bit under resistance.
That means we are still in bear territory, and it reminds us of what we all know so well; that bear markets have deceivingly strong rallies designed to draw us in and take away our money. The SPX chart looks like a 'no man's land' to me, and I think this is where we have no choice other than to wait to see what the market does next before making any new trades."

"Here is a really basic look at the SPX. I have been using this chart style with a simple uptrend line and horizontal support on a number of different indexes, looking for a simple sell signal.
If you look at the June peak in this chart, there were eight days of sideways action, and then the bottom fell out. I'm wondering if we are going to get similar price action this coming week. I'm looking for a decisive down day, with the closing price under the trend lines and a close at the lows of the day."

"I'm still a market bear looking for that next big leg down, but I'm trying to acknowledge my own negative bias and be prepared to be wrong."
There are a lot more charts in Gammons in depth look at the current state of the markets, including charts of Oil, Apple, Treasuries and the Dollar. His insights are those of a bear not yet out of the woods, to make a very strained pun.
After a long trek through the charts Gammons sums things up with these three bullets:
- "The short-term trend is up for stock prices as of June 24.
- The economy is at risk of recession as of March 2022.
- The medium-term trend is up for treasury bond prices as of July 22 (yields lower, prices higher)."
Before the July CPI report takes the headlines away from the positive Non-Farm Payrolls data two of our TalkMarkets contributors have a look at the labor market.
Contributor Jill Mislinski examines Employment: Services Vs. Goods Producing Jobs
"The latest monthly employment report showed a gain of 528K nonfarm jobs, which consists of a gain of 459K service-providing jobs and a gain of 69K goods-producing jobs."

"In 1939 service providing industries employed more people than goods-producing, 63.1% to 37.2%, a ratio of 1.7-to-1. World War II triggered a surge in goods-producing employment and an accompanying reduction in services. But following the war, we've seen a steady tilt toward services. The key drivers of this secular trend have been the growth of automation that reduces the need for human labor and the globalization of goods production...The current ratio of services to goods-producing has been essentially unchanged for the last decade. It is currently at 6.2 - which means there are 6.2 times as many service-providing jobs as there are goods-providing jobs.
Another notable insight in the chart below is the consistent impact of recessions on the relative growth of the two cohorts: Even though the unemployment rate increases during recessions, the employed service-providing population increases, and goods-producing jobs disappear. We also see that post-recession recoveries don't reverse this pattern."

There are several cuts at the goods producing vs service jobs data, but this look at the impact of the pandemic on both the S&P 500 and the services sector is nothing short of sensational (from a graphical perspective, at a minimum).

Closing out the column for today is contributor Charles Hugh Smith who examines the question, Are Older Workers Propping Up The U.S. Economy?
Smith's two charts below show 1) the growth in the +55 segment in the workforce, and 2) the disproportionate number of the +55 population still in the workforce. From this data he makes several observations, some of which, follow the charts.
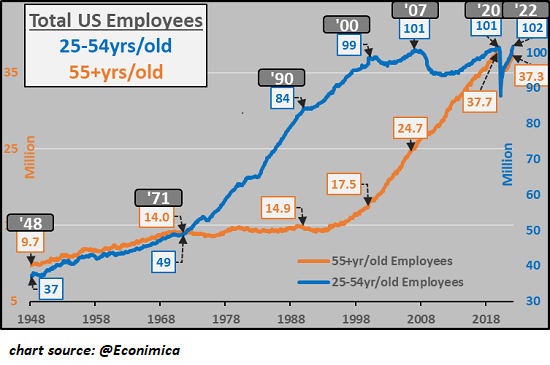
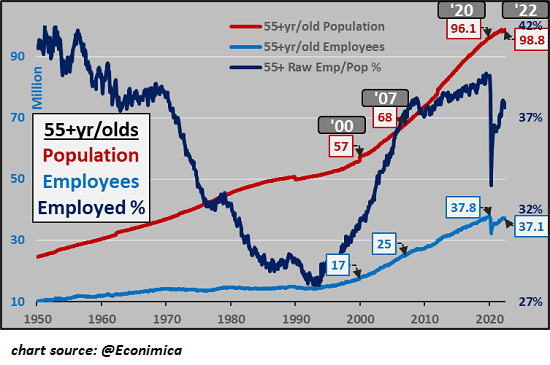
"The total U.S. population increased by 17%. The 55+ population increased by 42 million (from 57 million in 2000 to 99 million today), a 74% increase. Total employment in the 55+ cohort increased by 113%. In 2000, only 17.6% of the 55 and older populace had a job. Now the percentage is 37.5% A 20% increase in the percentage of 55+ who are employed in a 20-year span is unprecedented. If the percentage of employed 55+ had stayed the same, there would only be 17 million 55+ workers today. Instead, there are over 37 million."
"We can attribute this dramatic shift to a number of causes: older households that never recovered from the financial damage wrought by the 2008-09 Global Financial Meltdown; older workers (like me) who only have Social Security for retirement income who can't get by on just their SSA check; those who enjoy their work and see no reason to stop; people who retired and became bored out of their minds so they returned to the workforce; parents who keep working to help their offspring and/or elderly parents; people who keep working to maintain healthcare coverage until they qualify for Medicare; older entrepreneurs who can dial back their workload but who still love their work, and so on."
"All of these reflect structural changes in the U.S. economy: a steady decline in the purchasing power of wages and financial security, systemic exposure to the risks of financial bubbles bursting, etc. The bottom line is that nest-eggs that were deemed adequate are no longer adequate, and the only way to fill the gap is to keep earning money."
"These changes are reflected in the decline in the percentage of employed 55+ people from 28% in 1970 to 18% in 1990 and 2000, and the subsequent rise to 37%. In an economy with an expanding workforce of young employees and rising productivity, more older workers could retire early. This is no longer the case."
"In many cases, there is no nest-egg due to bankruptcy via huge medical bills, the heavy burdens of student loans, or the costs of helping children and grandchildren or very elderly parents. (Many of us aged 65-70 are taking care of parents 90+ years of age and helping out with active 3-year-olds. Retirement? You're joking.)"
"Are 55 and older workers propping up the U.S. economy? The data is rather persuasive that the answer is yes."
Have a good one.
I'll see you on Thursday.

Image: D. Marshall
More By This Author:
TalkMarkets Image Library
Thoughts For Thursday: Inflation Moves Manchin
Tuesday Talk: Wonder Rates


