
Tuesday Talk: Sniffing Bears Chased Out For Now
Bears are out and about sniffing around in what is an overall positive market environment and though they were routed on Monday, investors should be aware of their persistence to stay around and kick over more than a can or two.

Yesterday the S&P 500 closed at 4,523, up 17 points, the Dow closed at 34,585, up 76 points, and the Nasdaq Composite closed at 14245, up 131 points.

Chart: The New York Times
The top loser for the day was Verizon Communications (VZ), down 7.5%. followed by SBA (SBAC) Communications, down 7.2%, and AT&T (T), down 6.7%.

Chart: The New York Times
In morning futures action, S&P 500 market futures are down 2 points, Dow market futures are up 3 points, and Nasdaq 100 market futures are down 19 points.
The Staff at TalkMarkets contributor Bespoke Investments Group, details the Good and the Bad in, S&P 500’s Best And Worst Performers During A Monster Week.
"After weaker-than-expected inflation data inflated the prices of just about every financial asset, there were some very big winners by the end of last week. The table below lists the 20 top-performing stocks in the S&P 500 last week, which includes eight stocks that rallied more than 10%. Double-digit gains are typically considered very good for an entire year, so when large-cap stocks move that much in a week, it’s impressive."

"In total, there were just 88 stocks in the S&P 500 that declined last week, and only 53 of those fell more than 1%. Of those 53 stocks, the table below lists the 20 worst performers which all fell more than 3%.This is also an eclectic group in terms of both their lines of business and their YTD performance heading into the week...Unlike just about all of last week’s winners which are now overbought, many of the week’s worst performers are still trading within normal ranges of their 50-day moving averages."

Contributor David Templeton ponders what the market is trying to tell us in his article, Equity Market Telegraphing A Strengthening Economy?
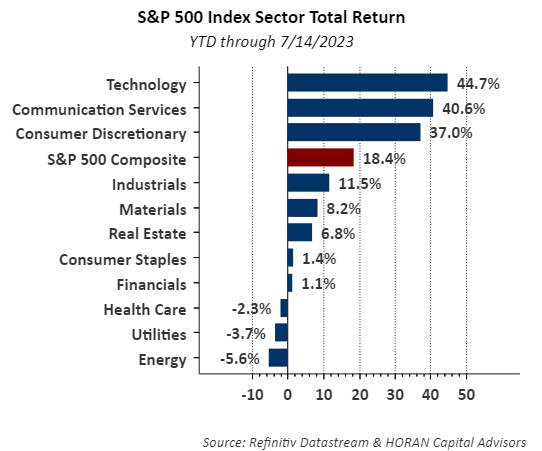
"About a year ago many strategists were calling for a U.S. recession to begin by mid-year this year. A part of the rationale behind this thinking was the pace of the Federal Reserve's interest rate increases which resulted in the yield curve inverting, i.e., short-term interest rates rising above long-term rates...With a little more than half the year behind investors, the S&P 500 Index is up 18.4% on a total return basis. Knowing the equity market and the economy are not necessarily the same, the equity market returns might provide a clue to the future direction of the economy. As the below bar chart shows, economically or cyclically oriented sectors have performed the best this year. Information Technology, Communication Services, Consumer Discretionary, and Industrial sectors are the four leading sectors."
"In the next chart, the orange line represents the equity market and the blue line represents the business cycle. Across the top of the chart are the economic stock sectors and the yellow highlight represents the sectors that are outperforming year-to-date as noted above. These are the sectors that perform the best coming out of an equity market bottom, and a market entering a bull market phase. The recovery of these four sectors tend to lead the recovery of the economy, in other words, the equity market is telegraphing a recovering or expanding economic environment."
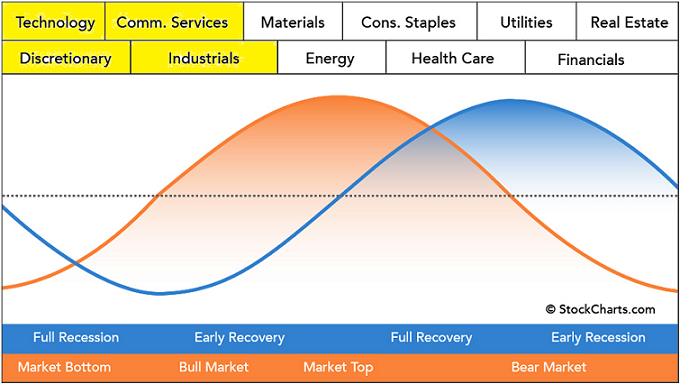
Chart Source: stockcharts.com Sector Rotation Analysis
"As this year unfolded the economic data has been mixed with some data at recessionary levels while other data is indicative of an economy that continues to grow. Much of the difficulty in interpreting the data is a result of the pandemic in my view...Certainly, the equity market seems in need of a breather given the magnitude of recovery off of the October 2022 low. With the economy possibly set to regain some momentum though, favorable returns seem a likely outcome in the second half of the year, but not higher in a straight line."
See the full article, for more.
TM contributor Giles Coghlan writes U.S. Retail Sales: An Insight Into The State Of The U.S. Economy.

"Just under three-quarters of all US economic activity comes from consumer spending. US retail sales data contains evidence of around one-third of that activity (though excluding service sector spending) So, this print can give a big hint at the overall state of the economy...
The lockdown of Covid sent US retail sales figures surging higher, but they have been steadily moving lower over the last few months. You can see the steady fall continuing over the last 12 months below:

This month’s reading is for June’s data and it is expected to fall to 1.1% y/y, but the month-on-month readings are expected to rise...
Investors will be looking for a clear move either higher or lower from the data as a collection. A sharp move lower in all the readings will likely be taken by investors to mean that the impact of the Fed’s rate hikes are starting to be felt by consumers and demand is cooling."
Contributor Jeffrey P. Snider offers a word of warning among the market euphoria noting that Income Tax Payments Have Plunged.
"Individual income tax payments to Uncle Sam are running almost half a trillion (with a "T") behind same months in FY 2022. Withholdings are way off and claimed refunds are way up. At the same time, the June CPI showed broad-based disinflation and a little deflation. These two results aren't unrelated."
Check out TM contributor Joseph James' 33 minute video This Double-Top Reversal Could Earn Massive Gains On Tuesday for his tips on how to play the market today.
"Buyers just retested last Friday’s high, and you’re probably wondering… is it time to short this Double-Top? It certainly might be…
But rather than “picking tops” in a bull market, I’ll be waiting for this reversal pattern because it might be the biggest winner of the week!
E-mini and Nasdaq are bullish, trading right into major resistance – buyers need to show us “proof” they can hold these highs, or sellers are going to attack!"
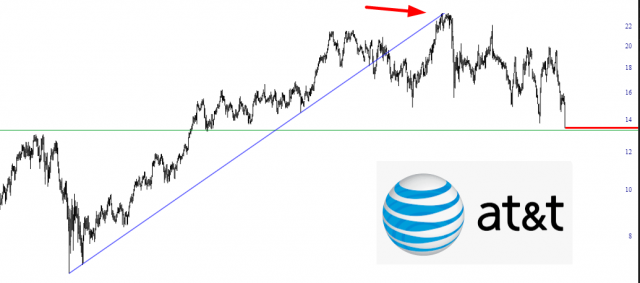
Closing out the column Tim Knight in his chart piece Ma Bell, gives us his take of AT&T, one of yesterday's top losers. As a perhaps contrarian note, most of the analysts who follow the stock have Buy or Hold advisories out for the stock.
"In this, shall we say, massively-supported environment, it’s rather stunning that a kingpin like AT&T would still be looking at nearly a 50% loss from its peak (!!!!!!). It all seems quite clear from the arrow that, once the uptrend was broken, there was one last gasp..."
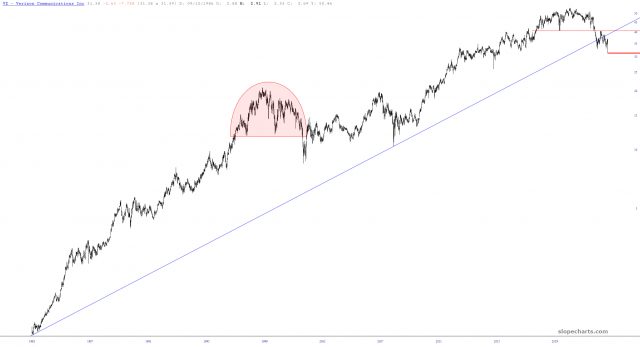
"By the way, Verizon is coming right along for the awful ride:"
As always, Caveat Emptor.
Have a good one.

More By This Author:
Thoughts For Thursday: One Down, One To Go!
Tuesday Talk: Stocks Break A Losing Streak But Rate Hikes Stalk The Markets


