Thoughts For Thursday: Slipsliding Sideways
The market has been slip-sliding all week, but with two more trading days to go, we might see it try to recover toward the upside before the weekend.

Yesterday, the S&P 500 closed at 4,404, down 34 points, the Dow closed at 34,766, down 181 points, and the Nasdaq Composite closed at 13,475, down 156 points.

Chart: The New York Times
Most actives were Tesla (TSLA), down 3.2%, followed by Advanced Micro Devices (AMD), down 3.7%, and Johnson and Johnson (JNJ), down 0.3%.
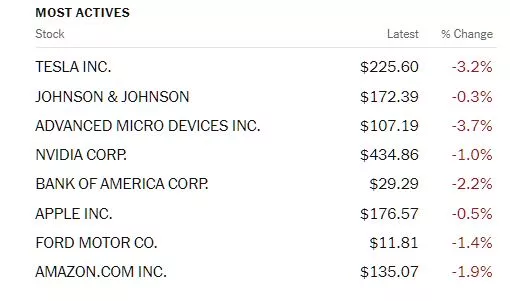
Chart: The New York Times
In morning futures trading, S&P 500 market futures are trading up 10 points, Dow market futures are trading up 78 points, and Nasdaq 100 market futures are trading up 37 points.
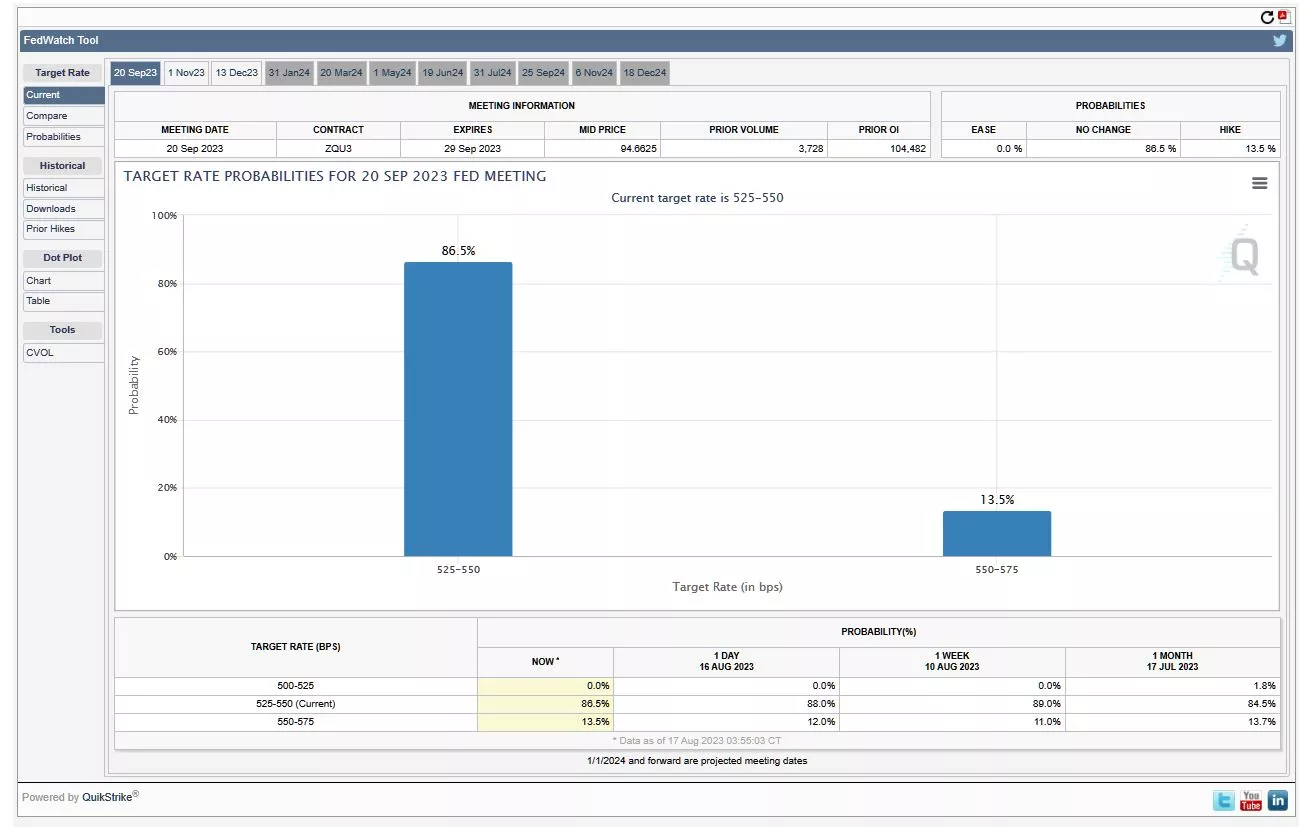
Inflation is still very much a market concern and following the release of the July FOMC meeting minutes yesterday, the percent of those expecting the Fed to increase rates again in September, inched up, just a bit. The CME FedWatch Tool is currently showing that 86.5% of respondents believe the Fed won't move rates in September and 13.5% expecting rates to increase by 25 basis points.
There is a mix of positive and negative reactions to the market's behavior among TM contributors.
TM contributor J. Brumley says Wednesday’s Selling Is No Small Problem For The Market.
"We knew it was a possibility. On Wednesday it became a reality. That is, teetering on the edge of a breakdown, Wednesday’s market losses pulled another major index below key technical floors. The path back to bullishness just got much tougher to navigate… or even find.
The S&P 500 is the index in question. With today’s 33.5 point/0.76% setback, the S&P 500 is now below its 50-day moving average line (purple) at 4449.15. That’s the first time since March the index’s been under that level."

"There is one semi-bright spot behind the move. That’s the lack of volume. As has been the case for a couple of weeks now, Wednesday’s volume was below average.
That’s a detail unique to the S&P 500, however. The Nasdaq Composite lost a lot of ground on Wednesday as well but did so on massive volume. It was already well under its 50-day moving average line at 13,796.7 but is even more so now. That puts a rebound further out of reach."

"Perhaps the biggest red flag on both of the charts above, though, is the one that looks the least suspicious. That’s the volatility indices of both the S&P 500 (SPX) and the Nasdaq Composite. While neither the VIX nor the VXN were catapulted higher today, they both clearly moved upward. The fact that they’re not “surging” or “spiking” is in some ways more bearish that they might be if they were moving higher in a big way. This gradual, shallow ascent leaves room more room for the VIX and VXN to continue climbing, with stocks sinking the whole time.
And make no mistake… the undertow is bearish. This is readily evident when looking at the market’s breadth and depth."
See the full article for additional analysis.
Contributor Sheraz Mian writes that Q2 Earnings Confirm Improving Growth Trends.

"The 2023 Q2 reporting cycle has come to an end for 10 of the 16 Zacks sectors, with results from almost 93% of the S&P 500 index companies already out.
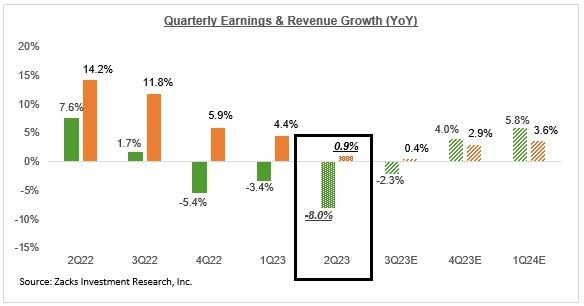
The blended growth for the quarter is on track for an earnings decline of -8.0% from the same period last year on +0.9% higher revenues. This would follow the -3.4% decline in index earnings in the preceding period (2023 Q1) and the -5.4% decline in the last quarter of 2022.
In other words, 2023 Q2 is expected to be the third consecutive quarter of declining S&P 500 earnings. The expectation currently is for another earnings decline in Q3 of -2.3%, after which growth turns positive in Q4 and continues in 2024. In fact, Q3 earnings would be positive had it not been for the Energy sector drag.
Zacks Investment Research
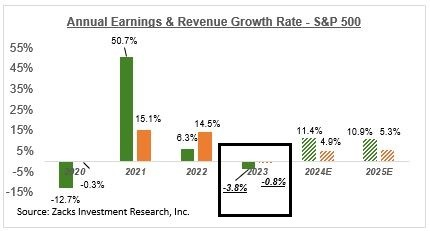
As you can see from these quarterly earnings-growth expectations, the long-feared recession doesn’t show up in this near-term earnings outlook. A big-picture view of corporate profitability on a long-term basis doesn’t leave much room for a recession either, as you can see in the chart below.
Zacks Investment Research
These growth expectations reflect current bottom-up consensus earnings estimates for the individual S&P 500 companies that, in turn, are based on the estimates from individual sell-side analysts that cover those companies."
Contributor Tim Fries notes China’s $3T Shadow Banking Exacerbates Contagion Risk.
"Alongside the chronically ill Evergrande property developer, another Chinese giant is in trouble. Trust company Zhongrong International Trust (ZRT) started missing payments to its extensive client base on August 8th, with no remedy in sight.
Zhongrong is under the umbrella of Chinese financialization provider Zhongzhi Enterprise Group (ZEG). Zhongzhi is China’s mini-BlackRock, managing $138 billion in assets. The firm’s board secretary, Wang Qiang, informed investors earlier in the week that no redemptions are incoming for at least 30 financial yield products due to dried-up short-term liquidity."

"It is estimated that 70% of China’s average household wealth is tied up in the housing market. Evergrande Group is China’s second-largest property developer, having accrued $340 billion in debt by the end of 2022. On August 28th, the group is yet to decide on its $3.2 billion restructuring plan to stave off collapse.
Amid this overleveraging, China’s new home prices are starting to fall. For the first time in 2023, July’s National Bureau of Statistics (NBS) data shows a 0.2% month-over-month drop. In less metropolitan regions, average new homes depreciate in at least 35 smaller cities, continuing a 17-month depreciation streak...
The freshly troubled Zhongrong is one of the holders of real estate liabilities as a part of China’s $2.9 trillion trust sector. Use Trust data shows that Zhongrong offers 270 yield products, expected to deliver ~$5.4 billion this year. With short-term liquidity running dry, that plan is now under a big question mark.
Spilling out of real estate exposure, China’s financial contagion could now spread to trust products...
China’s economy is a hybrid blend between officially sanctioned state capitalism and a grey economy. This has been evident for years in the crypto market, wherein China still produces the second-largest Bitcoin mining hashrate, despite cryptocurrencies being officially banned.
In the traditional sector, this manifests as shadow banking, ramping up in the late 1990s. As unregulated financial activities across trust companies and peer-to-peer lending, China’s shadow banking takes in riskier investments while presenting unfair competition to more regulated banks.
China’s shadow banking sector is estimated to be around $3 trillion, equal to the UK’s entire economy. In the present context of real estate exposure spilling into yield products, trust companies are the key pillars of this shadow sector.
The likes of Zhongrong have more leeway than banks to take in riskier exposure, and by doing that contagion risk is greater as well...
In addition to cracking down on publicizing these problems, China is taking a more proactive approach. While Fed Chair Jerome Powell is still in the “higher for longer” mode, the People’s Bank of China (PBOC) unexpectedly cut interest rates on Tuesday, from 2.65% to 2.50%
“All of these add to the urgency that policymakers need to act fast before consumer and business confidence deteriorate sharply,”
Tommy Wu, Commerzbank’s senior China economist
This was China’s second rate cut in three months, aiming to bolster commercial banks as it reduces their losses on net interest margins."

On the good news side contributor Mish Shedlock notes Industrial Production Jumps 1 Percent From Negative Revisions, Autos Lead The Way.
"Industrial Production Month-Over-Month Details
- Industrial Production: +0.99 Percent
- Manufacturing Durable Goods: +1.68 Percent
- Consumer Durable Goods: +2.70
- Motor Vehicles and Parts: +5.17 Percent
- Manufacturing: +0.46 Percent
- Aircraft and Parts: +1.59 Percent"

Industrial production numbers from the Fed, chart by Mish
Industrial Production Index

Industrial Production Index Since 1972
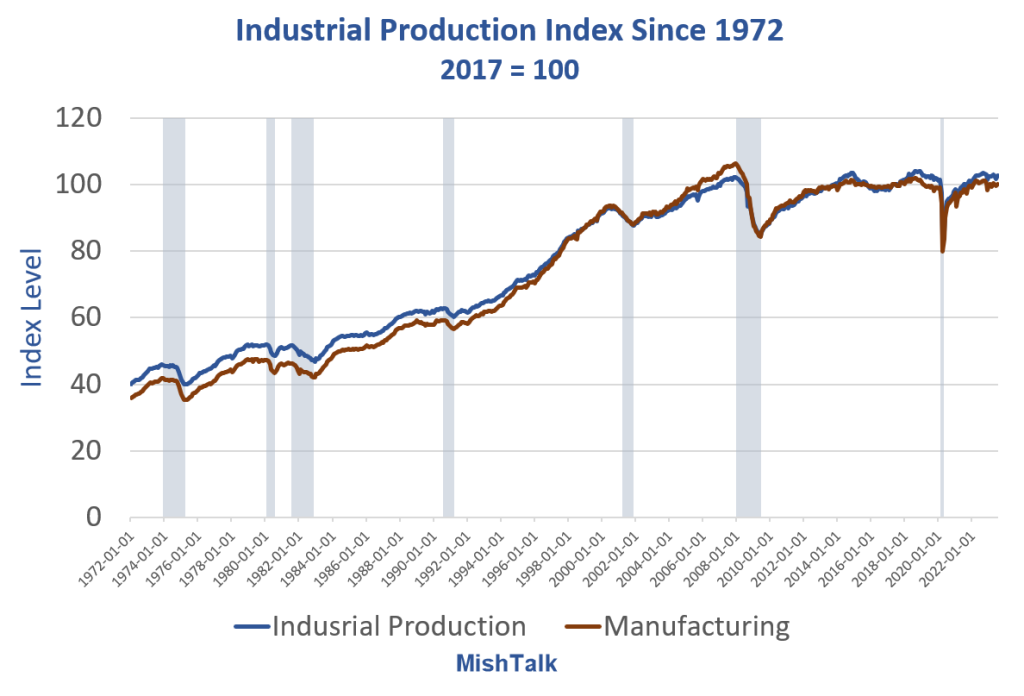
The manufacturing production index peaked at 106.42 in December of 2007, just before the Great Recession and has never reached a new high.
In October of 2022, the manufacturing index was 101.23, and that was the post-pandemic high.
The manufacturing index is currently 100.10.
Retail Sales Surge 0.7 Percent in July but Autos Decline 0.3 Percent
Meanwhile I am wondering about autos. Yesterday, I noted Retail Sales Surge 0.7 Percent in July but Autos Decline 0.3 Percent
Auto sales declined 0.3 percent but production is up 5.17 percent. That assumes no revisions which might be a big stretch."
The Staff at contributor Bespoke Investment Group comments, Stable Housing.
"The latest reads on Housing Starts and Building Permits for the month of June were released earlier this morning and showed mixed results relative to expectations (starts slightly better than expected, permits modestly weaker). The table below breaks down the report by single and multi-family units as well as on a regional basis. Two notable trends that stand out in the table concern single-family vs multi-family and regional trends. First, for both starts and permits, single-family was stronger than multi on both a m/m and y/y basis. Single-family units have more of an economic impact, so it’s good to see strength on that score. On a regional basis, we found it interesting to see that while most regions of the country experienced double-digit y/y increases in starts, permits in all-four regions were down by at least 9% on a y/y basis which would suggest that the pipeline for future starts is getting smaller."

See the full article for additional charts and report details.
For the close in the "Where To Invest Department", TalkMarkets contributor Benjamin Rains suggests, Bull Of The Day: Uber Technologies, Inc.
Rains does an excellent job of walking you through the company's current state, as well as what to expect going forward. Below are the front and end notes of the story. Read the full article for a good analysis of Uber (UBER).
"Uber Technologies, Inc. shares have soared 80% in 2023. The ride-hailing firm in early August reported GAAP operating profit for the first time in its history.
Wall Street has celebrated Uber’s ability to expand its ride-hailing and delivery businesses while simultaneously focusing on the bottom line. Uber crushed our Q2 earnings estimate on August 1 and boosted its guidance as ridership booms and delivery grows. Uber is also experimenting with new revenue streams.
Plus, Uber stock slipped recently on some post-release profit-taking and its valuation levels look enticing..."

"Uber trades at a 65% discount to its own highs at 2.2X forward sales and 43% below the Zacks tech sector. And its PEG ratio, which factors in its bottom-line growth outlook, sits at 1.2 vs. tech’s 2.0.
Bottom Line
Long-term investors might want to consider Uber as it proves it can thrive and grow market share in multiple key segments of the economy and become profitable at the same time.
Wall Street is very high on the stock, with 27 of the 33 brokerage recommendations Zacks has at “Strong Buys,” alongside four “Buys,” and two “Holds.” And Uber’s recent fall has taken it from overbought RSI levels to below neutral."
As always, caveat emptor.
Have a good one.

Image: D. Marshall
More By This Author:
Tuesday Talk: An August Itch
Thoughts For Thursday: Two Cups Of Coffee With the CPI Report


