
You'll probably want a second cup of coffee as you peruse this morning's Bureau of Labor Statistics July Consumer Price Index release. Expectations are that YoY July will come in higher, but core inflation numbers will remain flat from June. So mostly good news, though gasoline price increases in late July will only be reflected in the August numbers. On the other hand, it is summer and gas prices traditionally trend upwards, and no one should be surprised this year as Americans are back vacationing at pre-COVID levels.

So, with some expectation that the Fed will "shrug-off" the CPI increase, the market too, may take this in stride. Having said that, chop was very much in evidence in Wednesday's trading. Yesterday the S&P 500 closed at 4,468, down 32 points, the Dow closed at 35,123, down 191 points, and the Nasdaq Composite closed at13,722, down 162 points.
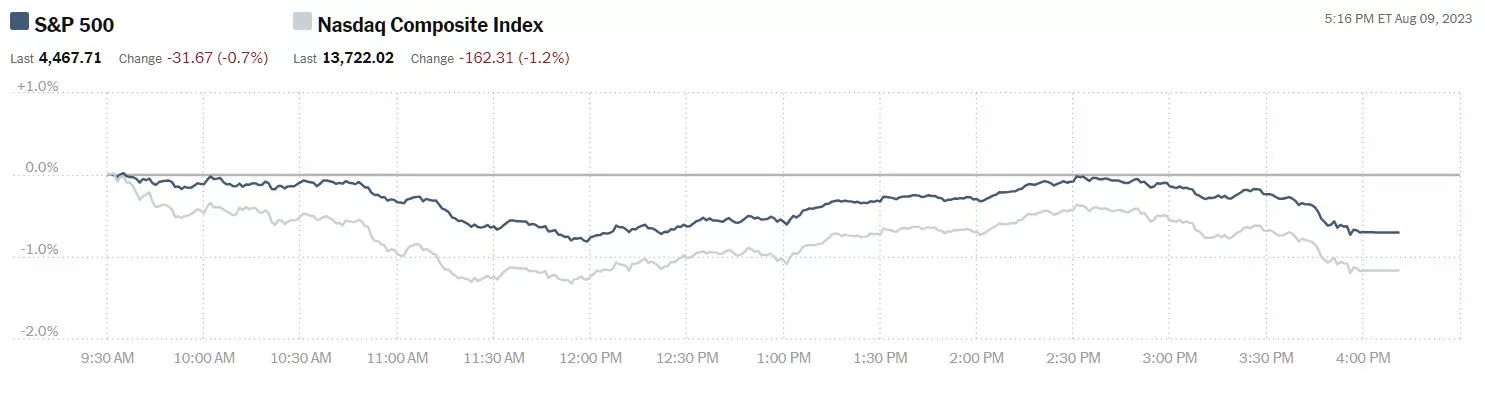
Chart: The New York Times
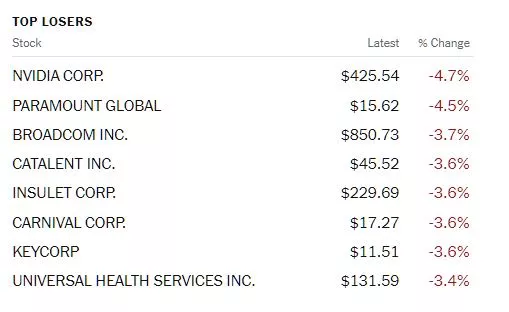
Leading the loser's pack was Nvidia (NVDA), down 4.7%, followed by Paramount Global (PARA), down 4.5%, on fears about effects on company performance due to the writer's and actor's strike, and Broadcom (AVGO), down 3.7, reflecting some weakness/corrective action in the Semiconductor sector.
In morning futures action, S&P 500 market futures are up 24 points, Dow market futures are up 177 points, and Nasdaq 100 market futures are up 98 points.
TM contributor and economist Menzie Chinn gives us two important looks at inflation in the US and deflation in China in CPI Inflation At Annual Rates, Using July Nowcast and Chinese Inflation In July.
"From Cleveland Fed; and compared to Bloomberg consensus.
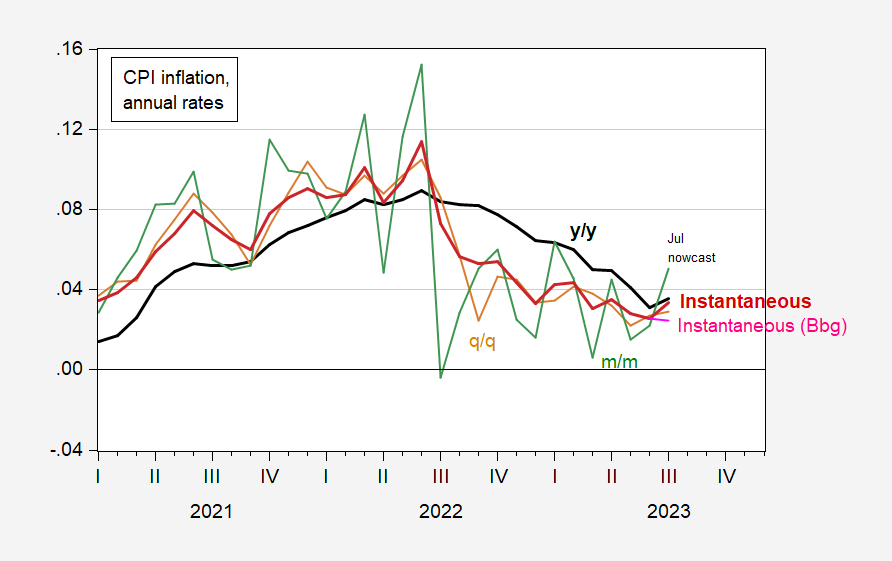
Figure 1: Annualized CPI inflation, year-on-year (bold black), quarter-on-quarter (tan), month-on-month (green), instantaneous per Eeckhout, T=12, a=4 (bold red) and instantaneous using Bloomberg consensus. Source: BLS, Cleveland Fed (accessed 8/9/2023), Bloomberg, and author’s calculations.
Note that year-on-year CPI inflation will have a bump up if Cleveland Fed’s nowcast of 0.4% m/m headline inflation proves right. So too will instantaneous (3.5% annual rate). However, the Bloomberg consensus is for 0.2%, which means in a slightly declining instantaneous inflation rate (2.4% annual rate)."
And in China the picture is very different.
"Year-on-year CPI inflation goes negative (-0.3% vs. -0.4% consensus), and month-on-month is positive.
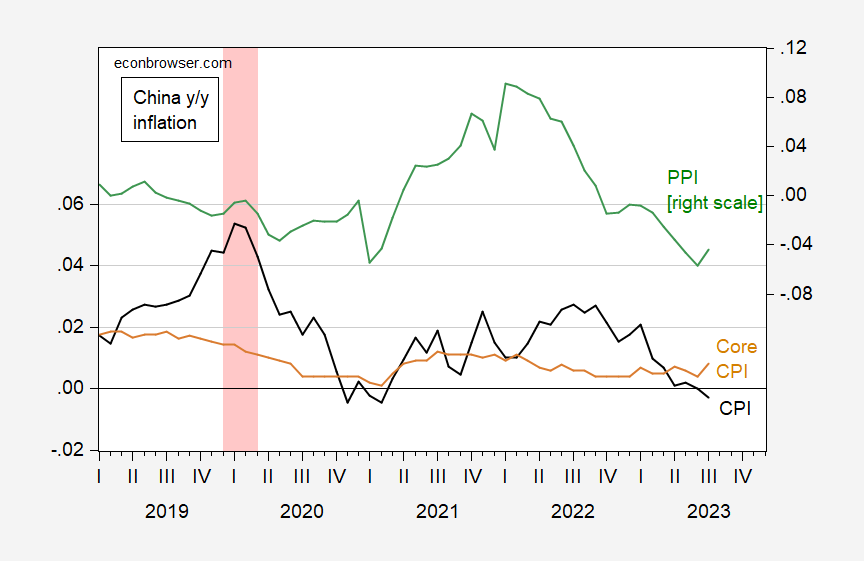
Figure 1: China year-on-year inflation rate for CPI (black), for core CPI (tan), and for PPI (green). ECRI defined peak-to-trough recession dates shaded pink. Source: Kose/Ohnsorge – World Bank and IMF, IFS, both updated using TradingEconomics; and author’s calculations.
So, on a year-on-year basis, headline CPI is falling, i.e. there’s deflation."
In an Editor's Choice piece, TalkMarkets contributor Ironman reports that Trade Shrinks Between The U.S., The World, And China.
"The value of goods the U.S. traded with the world plunged in June 2023. This may be the biggest economic story in the world that isn't getting enough serious news coverage. Most of that coverage is focusing on the U.S. trade deficit shrinking during the month because of a sharp drop in imports...
The following chart presents two data series over the period from January 2017 through June 2023. The upper, thicker dark blue curve represents the trailing twelve-month average of the sum of U.S. exports to and imports from the entire world. The lower, thinner light blue curve represents the trailing twelve-month average of the U.S.' combined imports and exports without the portion of its trade that's with China."

"...Treating the red dotted lines as counterfactuals (they're really a linear projection of the U.S. trade with the world without China from October 2022 through February 2023), we find the U.S.' trade with the world not including China has shrunk by about $25 billion between February and June 2023. When China is included, the gap increases to around $35 billion.
The next chart focuses just on the U.S.' trade with China. Here the thinner purple curve represents the monthly raw combined imports and exports between the two countries, while the thicker, black curve represents the trailing twelve-month average of the monthly data. Here, we've also presented a counterfactual of what the trade between the U.S. and China would look like if it followed the pattern of the recovery of trade between the two countries after the 2008-09 recession."

"...As of June 2023, there is a $10 billion gap between the counterfactual and the trailing twelve-month average of the value of goods traded between the U.S. and China.
Now, for the kicker. Looking forward to July 2023's trade data, China is reporting its trade with the world dropped sharply... that is a pretty good sign that what we're seeing in the U.S. trade data will be continuing when the U.S. reports its July trade figures."
Data worth following.
Time to shift to the "Where To Invest Department" for some positive news.
Contributor Sheraz Mian writes that Tech Sector's Earnings Outlook Reflects Improvement. Below are some of the highlights.

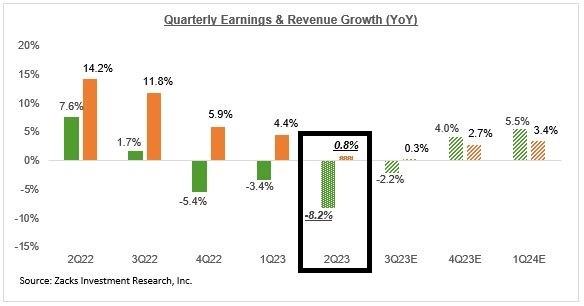
"2023 Q2 is expected to be the third consecutive quarter of declining S&P 500 earnings. The expectation currently is for another earnings decline in Q3 of -2.2%, after which growth turns positive in Q4 and continues in 2024. In fact, Q3 earnings would be positive had it not been for the Energy sector drag."
"Earnings estimates in the aggregate for the S&P 500 index have come down only a touch since the start of April, with a number of key sectors starting to see modest positive estimate revisions. These sectors include Construction, Industrial Products, Autos, Tech, Medical, and Retail.
(In Tech), Meta (META) is currently expected to bring in $3.44 per share in earnings in Q3 on $33.45 billion in revenues, representing year-over-year growth rates of +109.8% and +20.7%, respectively. Please note that the $3.44 per share Q3 estimate for Meta has risen +16.6% over the past month.
The current Q3 estimate for Amazon (AMZN) has literally been shooting higher, with the current estimate up +43.6% over the past month. The same for Alphabet (GOOGL) has risen by +7.5% over the same time period.
Hard to tell at this stage if the revisions trend will remain on its recent positive trajectory or revert back to its original negative trend. But it is nevertheless a market-friendly development."
Contributor Zacks Equity Research reports Walt Disney Beats Q3 Earnings Estimates.
"Walt Disney (DIS - Free Report) came out with quarterly earnings of $1.03 per share, beating the Zacks Consensus Estimate of $0.99 per share. This compares to earnings of $1.09 per share a year ago. These figures are adjusted for non-recurring items.
This quarterly report represents an earnings surprise of 4.04%. A quarter ago, it was expected that this entertainment company would post earnings of $0.89 per share when it actually produced earnings of $0.93, delivering a surprise of 4.49%.
Over the last four quarters, the company has surpassed consensus EPS estimates three times."

"It will be interesting to see how estimates for the coming quarters and current fiscal year change in the days ahead. The current consensus EPS estimate is $0.79 on $21.49 billion in revenues for the coming quarter and $3.74 on $89.24 billion in revenues for the current fiscal year."
As a run-up to this morning's July CPI data release we take a quick look at TM contributor Patrick Munnelly's Daily Market Outlook.
"Asian equity markets posted mixed performance, as the local markets mostly remained range bound. A flurry of earnings releases influenced the atmosphere, while caution prevailed ahead of forthcoming US inflation data. Additionally, market participants deliberated on US initiatives to limit investments in select Chinese tech companies...
The primary focus of the day will be on the release of US Consumer Price Index (CPI) data at 8:30 EDT. Financial markets will closely scrutinize the data for any indications that could provide clarity regarding the future interest rate outlook, particularly after the mixed labor market report from the previous week. Despite US CPI inflation having dropped to 3% year-on-year in June, the expectation is for July's figure to show a minor uptick to 3.3% year-on-year due to unfavorable base effects from the previous year. However, the month-on-month change in prices is projected to support the notion of a gradual economic adjustment, with an anticipated increase of market consensus at 0.2%...
On a broader scale, the movement in oil prices and renewed concerns about food security as the year progresses suggest that the lowest point for headline inflation this year might already be behind us...
However, in contrast to the headline rate, core price inflation is projected to diminish further in the latter half of 2023."
Have a good one.

More By This Author:
Tuesday Talk: Waiting For The CPI, Market Takes No Prisoners
Thoughts For Thursday: Expectations Met, Time To Go Fishing?


Comments
Log in or sign up to join the conversation.