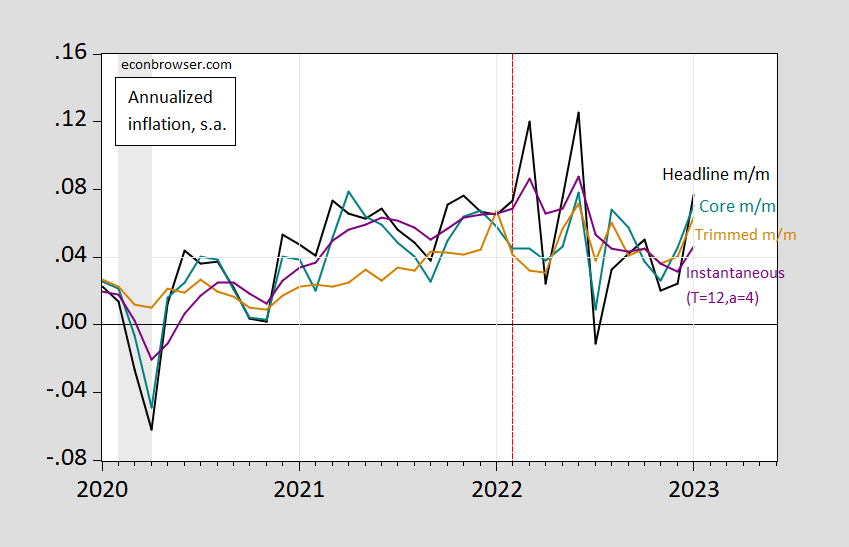
PCE Inflation – Headline, Core, Trimmed Month-On-Month And Instantaneous

Core PCE y/y 4.7% vs. 4.3% consensus, headline 5.4% vs. 5.0%.
Figure 1: Month-on-month PCE inflation (black), Core PCE (teal), trimmed PCE (tan), and instantaneous PCE inflation, T=12,a=4 (purple). NBER defined peak-to-trough recession dates shaded gray. Red dashed line at expanded Russian invasion of Ukraine. Source: BEA, NBER, author’s calculations.
Month-on-month indicators exhibit lots of volatility, even core and trimmed measures. That being said, m/m measures rose in January. The instantaneous measure (discussed in this post) rose less than the others, unsurprisingly given the weight on previous m/m changes.
More By This Author:
Dealing With Seasonality With 12 Month Changes: The QCEW
Employment Levels And Cumulative Changes: Tales From The QCEW
Do Declining Imports Signal And Imminent Recession?


