
Maybe. Maybe not. Some reasons to wonder.

As Calculated Risk notes, LA port traffic is down. A decline in port traffic usually signals a downturn in imports. Figure 1 shows the evolution of these two series before and during the pandemic.
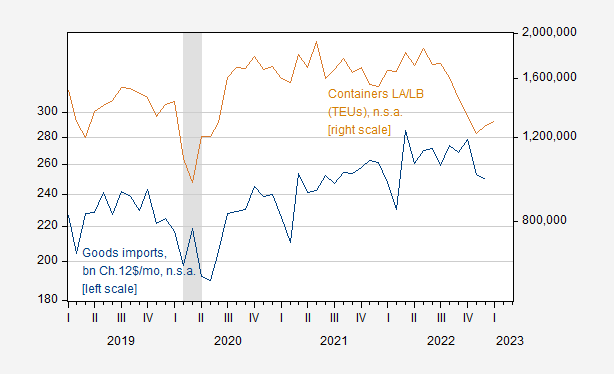
Figure 1: Goods imports in billions Ch.2012$/mo, n.s.a. (blue, left log scale), and containers (TEUs) at LA and Long Beach ports, n.s.a. (tan, log right scale). Real imports calculated deflating by import price deflator obtained from seasonally adjusted series. NBER defined peak-to-trough recession dates shaded gray. Source: Census, Port of LA, Port of Long Beach, NBER, and author’s calculations.
A regression of one series on the other yields an adj-R2 of 0.32, with a slope coefficient (log-log) of 0.32. Each 1% increase in container traffic at LA and Long Beach ports is associated with a 0.3% increase in real goods imports.
Imports are indeed declining as far as we can tell, for data going through December, and if port traffic is any indicator, January (n.s.a.) imports will remain depressed relative to past peak.
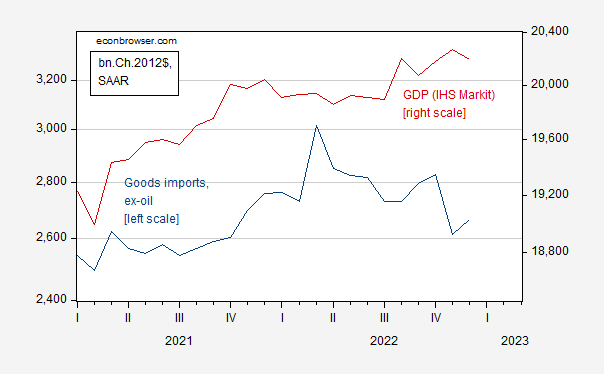
Figure 2: Goods imports ex-oil (blue, left log scale), and monthly GDP (red, right log scale), both in billions Ch.2012$ SAAR. Source: BEA/Census and IHS Markit/SP Global.
In fact, imports have fallen more drastically than GDP in the last 3 recessions (and in fact, GDP did not fall in the 2001 recession). In the 2007-09 recession, I noted that the collapse in imports suggested a deep recession was likely (see top right graph in Figure 3 below).
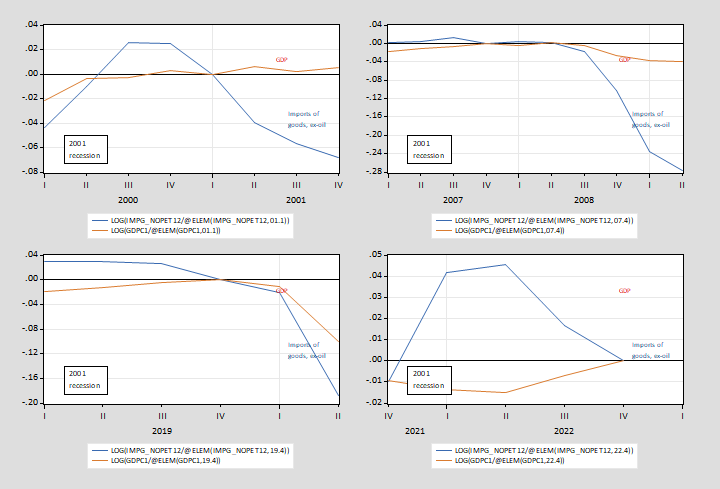
Figure 3: GDP (tan), and imports of goods ex-oil (blue), both in logs, normalized to 0 at NBER peak (red dashed line). Normalization for 2022 assumes peak at 2022Q4. Source: BEA, NBER, and author’s calculations.
Interestingly, the current situation differs from past; non-oil imports have been falling as GDP has risen, in the past two quarters (taking 2022Q4 as peak).
One reason not to think imports predict a recession this time around is the anomalous behavior of goods consumption during the pandemic. Figure 3 shows the goods consumption and imports consumption relative to levels at 2020M02 (NBER defined peak).
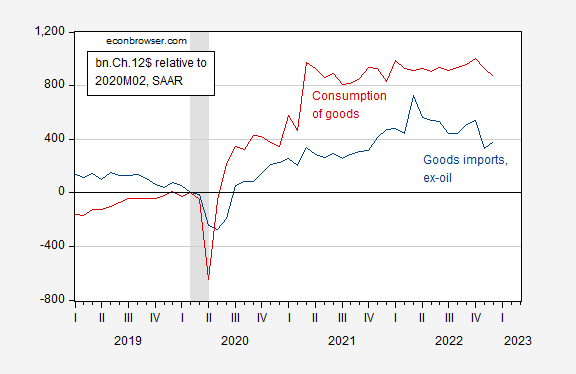
Figure 4: Goods imports ex-oil (blue), and consumption of goods (red), both difference from 2020M02, in billions Ch.2012$ SAAR. NBER defined peak-to-trough recession dates shaded gray. Source: BEA, NBER, and author’s calculations.
Imports of goods were high because consumption of goods was high. The deceleration of the latter is then consistent with the depressed (relatively) level of goods imports.
So it might be the case that lower goods imports are signalling a slowdown. Indeed, that is at least part of the story (as can be seen in lower aggregate — goods and services — consumption, which peaked in 2022M10). But the other part of the story is the normalization of consumption patterns, and a reallocation of spending toward services and away from goods.
That being said, consensus is still for recession, in Q1 (IHS Markit/SP Global) or 2023H2 (for others), while GS has taken the likelihood to 35%.
More By This Author:
Weekly Macro Indicators Thru 2/11: Up, Up And Away, Or Slow Deceleration?
January 2023 PPI
Business Cycle Indicators, Mid-January 2023


Comments
Log in or sign up to join the conversation.