January 2023 PPI
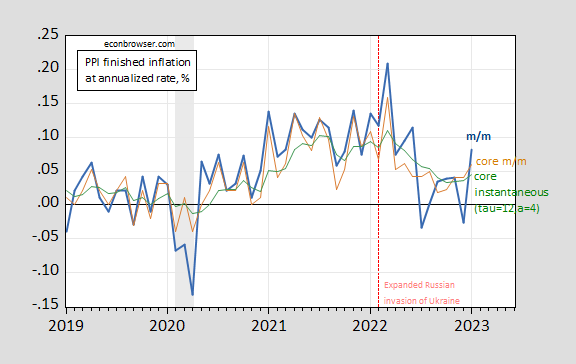
The core figure exceeds consensus (y/y 5.4% vs. 4.9% Bloomberg).

Figure 1: Month-on-month annualized PPI inflation (bold blue), Core PPI inflation (tan), instantaneous Core PPI inflation (τ=12,a=4) (green). NBER defined peak-to-trough recession dates shaded gray. Source: BLS via FRED, and author’s calculations.
Core instantaneous inflation (τ=12, a=4) rises noticeably less than core m/m.
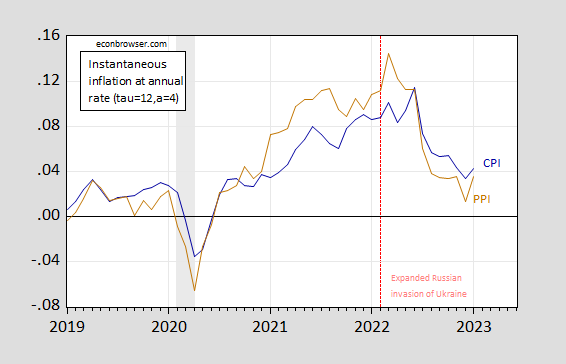
Figure 2 shows instantaneous CPI and PPI (finished goods and services) inflation.

Figure 2: Instantaneous CPI inflation (τ=12,a=4) (dark blue), and instantaneous PPI inflation (τ=12,a=4) (brown). NBER defined peak-to-trough recession dates shaded gray. Source: BLS via FRED, and author’s calculations.
The markets are taking the core PPI numbers, in conjunction with retail sales and CPI numbers, as indicating higher inflation – and hence higher terminal Fed funds rates – than a week ago.
More By This Author:
Business Cycle Indicators, Mid-January 2023January Inflation
Forecasters Up Projections Of GDP, Employment


