
Industrial production at consensus, while manufacturing production and retail sales above. For conjunctural analysis, industrial production is what NBER Business Cycle Dating Committee pays more attention to.
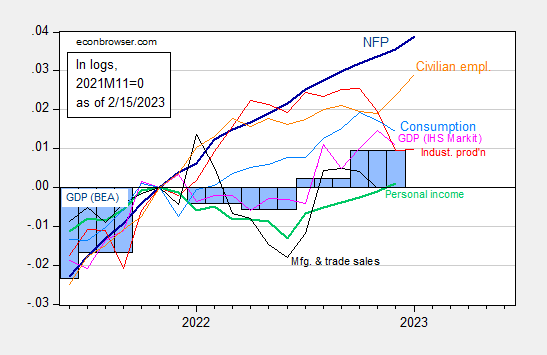
Figure 1: Nonfarm payroll employment, NFP (dark blue), civilian employment (orange), industrial production (red), personal income excluding transfers in Ch.2012$ (green), manufacturing and trade sales in Ch.2012$ (black), consumption in Ch.2012$ (light blue), and monthly GDP in Ch.2012$ (pink), GDP (blue bars), all log normalized to 2021M11=0. Q3 Source: BLS, Federal Reserve, BEA, via FRED, IHS Markit (nee Macroeconomic Advisers) (2/1/2023 release), and author’s calculations.
Manufacturing production, which is not directly influenced by weather conditions (namely warmer than expected), rebounded, 1% m/m, above 0.8% consensus.
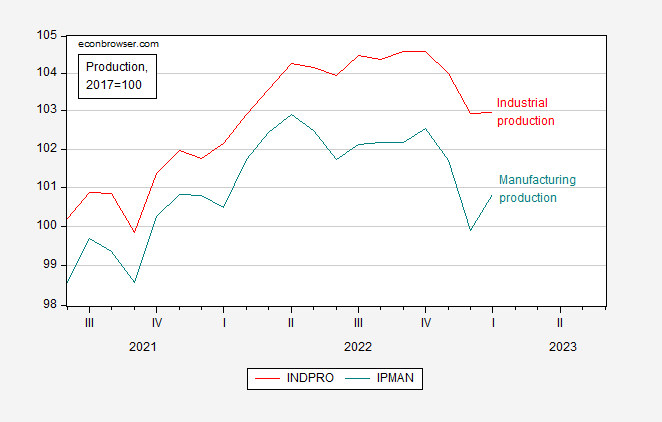
Figure 2: Industrial production (red), and manufacturing production (teal), both 2017=100. Source: Federal Reserve Board via FRED.
Finally, retail and food service sales — which gives us some insight into consumption, was also above consensus (3.0% vs. 1.8% consensus).
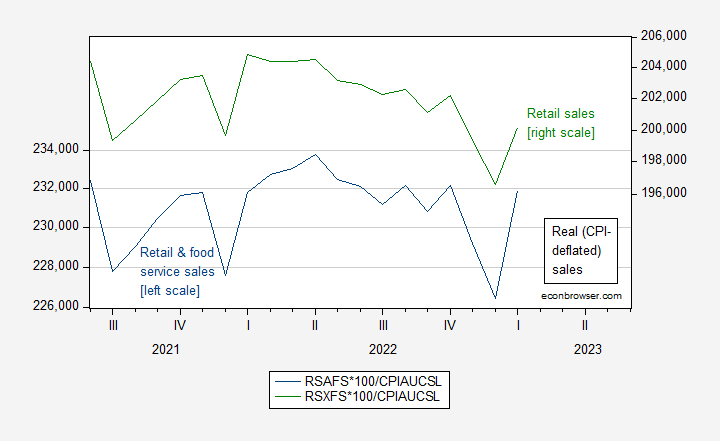
Figure 3: Retail and food service sales (blue, left scale), and retail sales (green, right scale), in 1982-84$ millions/month (CPI deflator). Source: Census via FRED, BLS, and author’s calculations.
The growth in retail sales suggests consumption remains strong.
More By This Author:
January InflationForecasters Up Projections Of GDP, Employment
Sentiment And Misery (And Maybe Partisanship)


Comments
Log in or sign up to join the conversation.