Employment Levels And Cumulative Changes: Tales From The QCEW
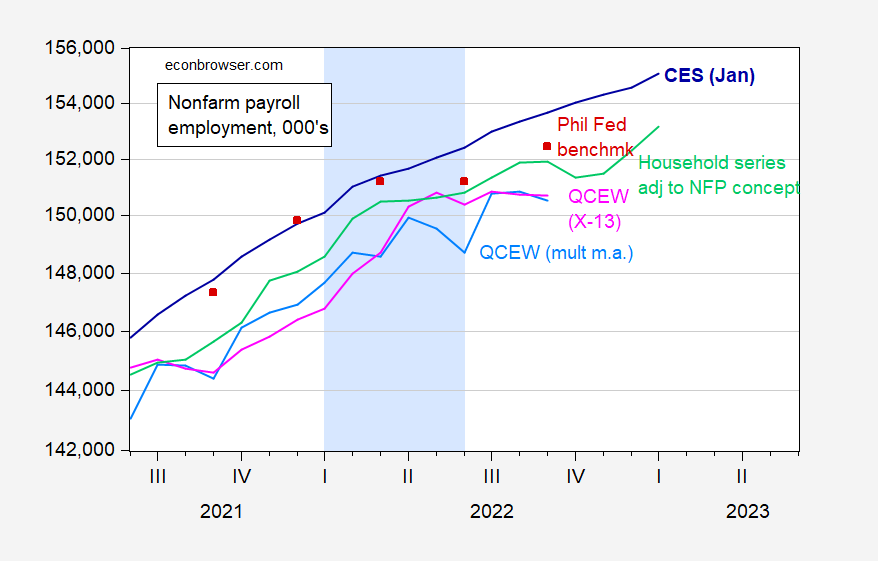
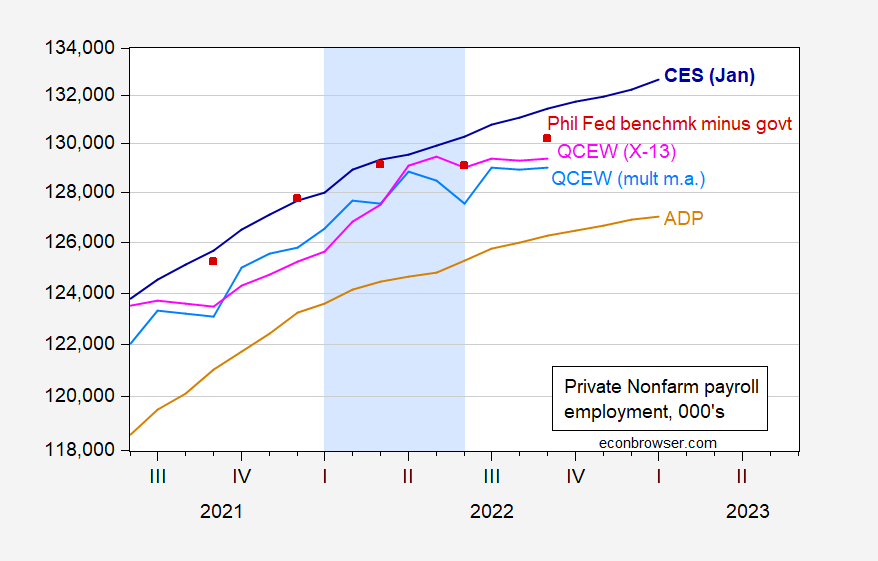
Quarterly Census of Employment and Wages data were released today. Recalling that some observers were claiming a recession occurred in 2022H1 (and/or 2022Q2) because household survey and QCEW employment numbers had flattened. With revised Q1 and Q2 data and new Q3 data, we have the following pictures of levels for nonfarm payroll employment and private nonfarm payroll employment.
Figure 1: Nonfarm payroll employment from January 2023 CES release incorporating benchmark revisions (blue), ADP (tan), QCEW total covered workers, seasonally adjusted using log transformed Census X-13 (pink), using multiplicative moving average (sky blue), Philadelphia Fed preliminary benchmark (red squares), all in 000’s, s.a. Light blue shading denotes a hypothesized 2022H1 recession. Source: BLS (various) and ADP via FRED, BLS QCEW, Philadelphia Fed via FRED, and author’s calculations.
Figure 2: Private nonfarm payroll employment from January 2023 CES release incorporating benchmark revisions (blue), ADP (tan), QCEW private covered workers, seasonally adjusted using log transformed Census X-13 (pink), using multiplicative moving average (sky blue), Philadelphia Fed preliminary benchmark minus reported government employment (red squares), all in 000’s, s.a. Light blue shading denotes a hypothesized 2022H1 recession. Source: BLS (various) and ADP via FRED, BLS QCEW, Philadelphia Fed via FRED, and author’s calculations.
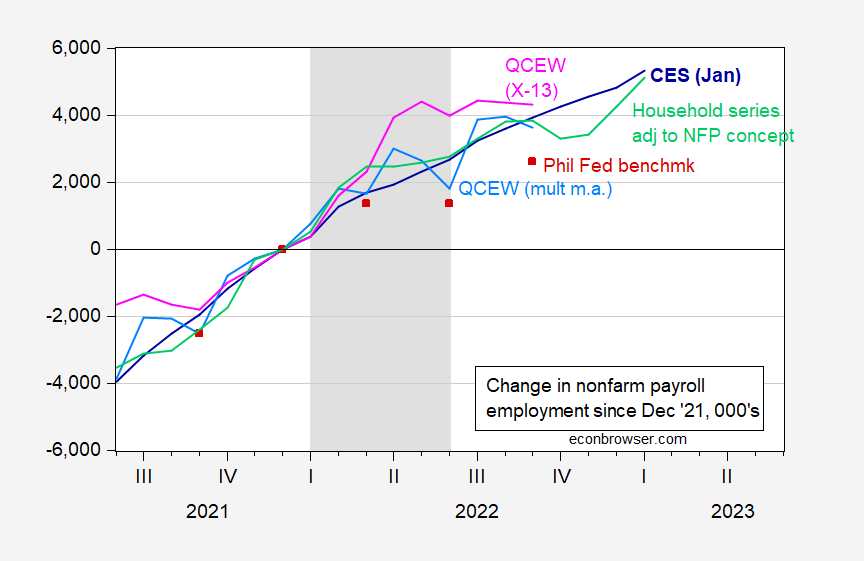
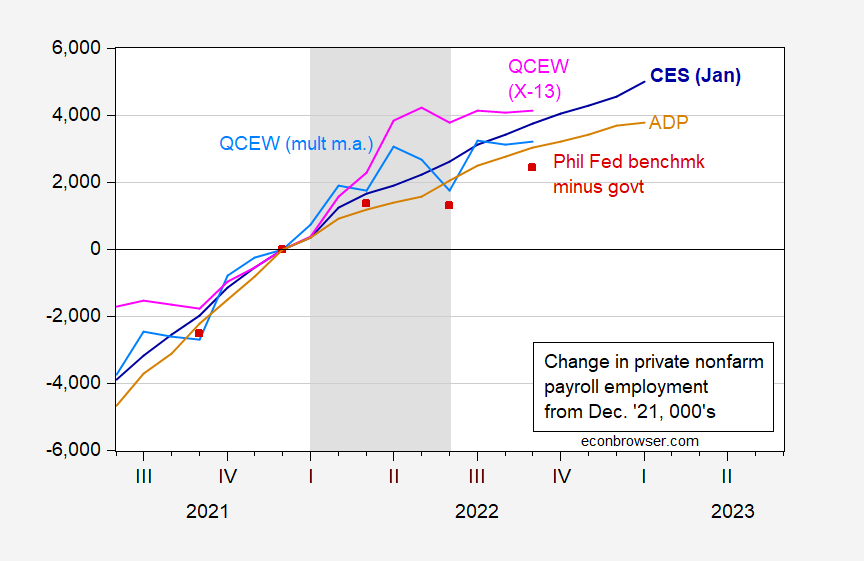
Now, since coverage differs, it’s hard to see if the number of jobs actually increase or not throughout the 2022H1 period. Hence, I show cumulative changes from December 2021 (in 000’s).
Figure 3: Change from December 2021 in nonfarm payroll employment from January 2023 CES release incorporating benchmark revisions (blue), ADP (tan), QCEW total covered workers, seasonally adjusted using log transformed Census X-13 (pink), using multiplicative moving average (sky blue), Philadelphia Fed preliminary benchmark (red squares), all in 000’s, s.a. Light gray shading denotes a hypothesized 2022H1 recession. Source: BLS (various) and ADP via FRED, BLS QCEW, Philadelphia Fed via FRED, and author’s calculations.
Figure 4: Change from December 2021 in private nonfarm payroll employment from January 2023 CES release incorporating benchmark revisions (blue), ADP (tan), QCEW private covered workers, seasonally adjusted using log transformed Census X-13 (pink), using multiplicative moving average (sky blue), Philadelphia Fed preliminary benchmark minus reported government employment (red squares), all in 000’s, s.a. Light gray shading denotes a hypothesized 2022H1 recession. Source: BLS (various) and ADP via FRED, BLS QCEW, Philadelphia Fed via FRED, and author’s calculations.
The astute observer will see that every series in Figure 3 is higher at end of 2022H1 than it was at the end of 2021H2. Every series, save the Philadelphia Fed’s early benchmark, is higher at 2022M06 than at 2022M03.
In Figure 4 (private nonfarm payroll employment), once again every series is higher at the end of 2022H1 than it was at the end of 2021H2. Two series — the Philadelphia Fed early benchmark minus measured government employment and QCEW seasonally adjusted using moving average — show a slight decline going from March to June. But all other series (including the ADP series which relies upon actual payroll processing data, and hence independent of CES or CPS) were rising.
To the question of trends going forward, every single series is higher at 2022M09 than 2022M03.
So, in assessing this comment from January :
The first pertains to the credibility of sources. Which should we believe? The CES or the HH survey? Menzie argued for the CES. This seemed somewhat problematic in H1, as we saw decreasing productivity and falling GDP. If we were adding so many full time jobs, why was both productivity collapsing and GDP declining?
The HH (CPS) survey, by contrast, was showing that 1) employment was flat after March, and 2) that more than 100% of the job gains were coming from part time work or multiple jobs, suggesting a surge in lower wage work resulting in a negative effect on productivity. That seemed more plausible to me.
At the same time, I thought it possible that both surveys were in fact correct, but garbled with the effect of the recovery from the suppression, thereby creating misleading impressions because we were misinterpreting the data. That still seems possible, though I’ve read that others think the CES was manipulated to provide a more rosy picture heading into the election. In any event, if one thought that both surveys might be in some sense correct, perhaps the discrepancy could be reconciled by multiple job holders. As it turns out, though, multiple jobs only account for 314,000 of 2.7 million jobs per the CES in the March-Nov. period, the period I believe we were debating. So that supposition proved incorrect, as Menzie pointed out and I acknowledged.
Then we learned that the CES was fundamentally incorrect, with the Fed reducing the increases in jobs from 1.1 million to 10,500 from March to June. For that period, it rendered the whole reconciliation issue moot, for it asserted that the CES had been producing phantom jobs. No reconciliation was needed.
As such, the HH survey appears to be the more credible source, certainly through June and probably through most of the rest of the year. And that suggests that the growth in employment has come entirely from part time and multiple job holders.
We can say almost all of what is stated is wrong. On part time jobs. On CPS vs. CES. On CES manipulation, there is no evidence (unless you found it on the Italian satellites changing vote counts). On lower wages causing measurably lower productivity, that’s so wrong that I can’t even say anything. On the comment: “Then we learned that the CES was fundamentally incorrect, with the Fed reducing the increases in jobs from 1.1 million to 10,500 from March to June.” , I will observe that it was researchers at the Philadelphia Fed that reduced the estimated job increase count, not the Fed as an institution.
More By This Author:
Do Declining Imports Signal And Imminent Recession?
Weekly Macro Indicators Thru 2/11: Up, Up And Away, Or Slow Deceleration?
January 2023 PPI


