
Undershoots consensus at 0.4%. M/M headline at -0.1 vs 0.3%.
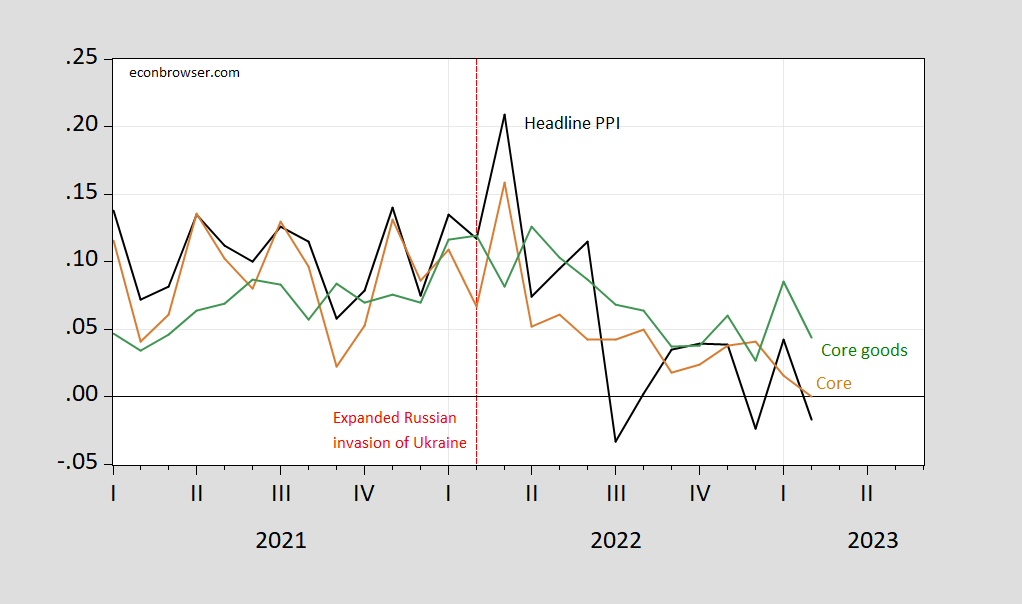
Figure 1: Annualized month-on-month PPI inflation (black), core PPI (tan), and core goods PPI (green), all in %. Source: BLS, and author’s calculations.
Instantaneous inflation (T=12, a=4) exhibits the same downward trend that core does.
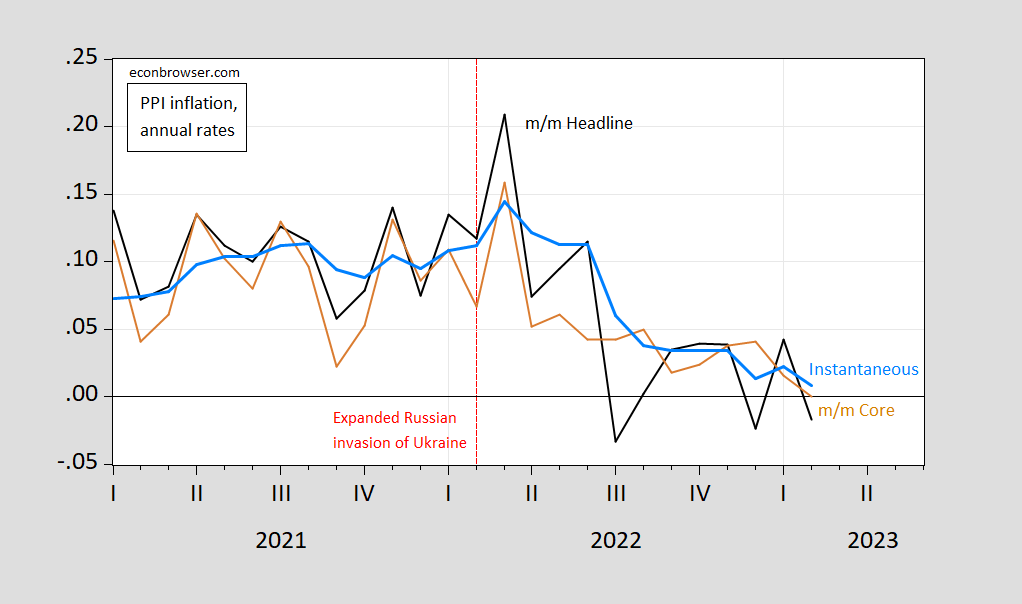
Figure 2: Annualized month-on-month PPI inflation (black), core PPI (tan), and instantaneous PPI inflation, T=12, a=4 (sky blue), all in %. Source: BLS, and author’s calculations.
More By This Author:
Spreads And Uncertainty/Risk Measures Post-SVB, Post-CPI Release
Inflation Surprise Barely Moves Expected Fed Funds Path
The Term Spread and Recession, Across Countries


Comments
Log in or sign up to join the conversation.