
Cognitive Dissonance Is On Full Display
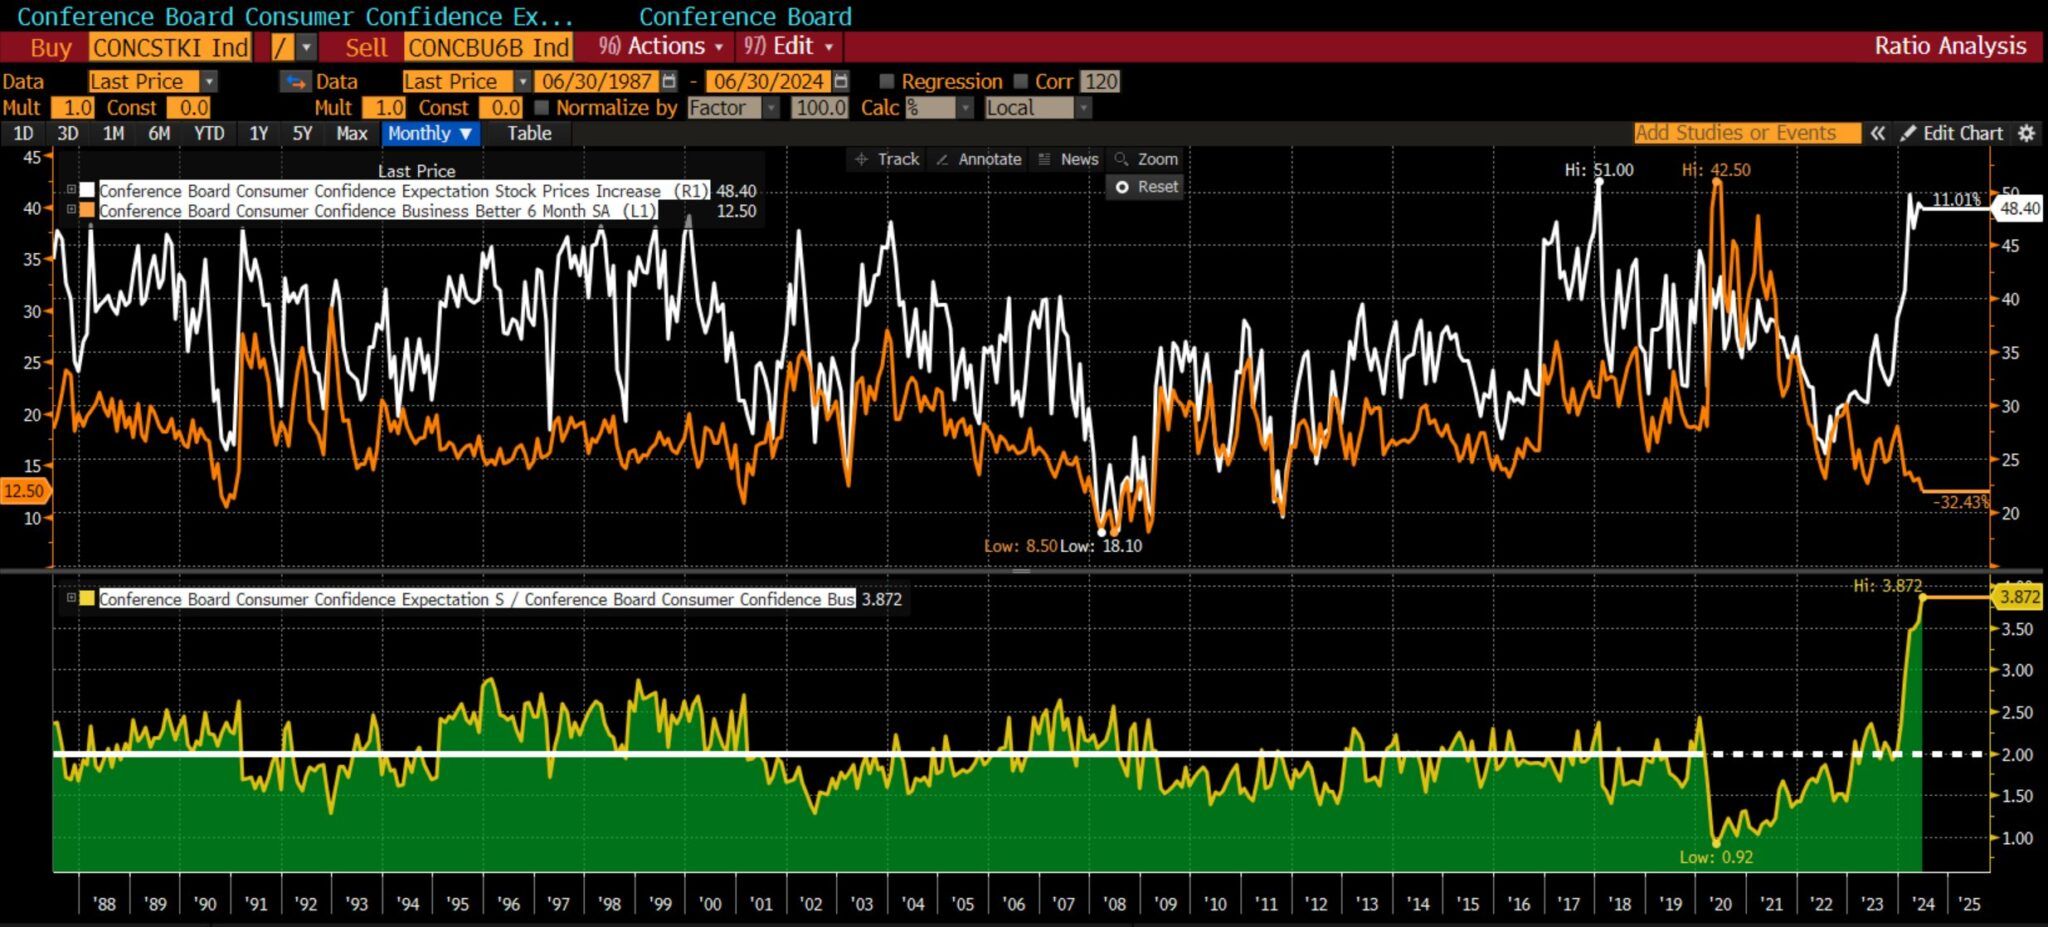
The recent Conference Board Consumer Confidence survey data show a state of cognitive dissonance among U.S. citizens. Cognitive dissonance occurs when a person believes in two contradictory things simultaneously. For instance, the latest Conference Board survey shows that expectations for increasing stock prices are among the highest since the late 1980s. However, citizens believe the business climate for the next six months will be among the worst environments over the last 35+ years. The graph below, courtesy of Michael Green, shows the two data series. Most often, they are correlated, rising and falling in unison. However, the recent gap is well beyond past experiences. The green chart at the bottom divides stock expectations by business expectations. It sits well above anything witnessed since the late 1980s.
In the short term, stock prices are a function of liquidity and investor behaviors. Over extended periods, prices represent the value of a company’s cash flows, which are highly predicated on economic activity and the business climate. Thus, investors can, at times, have cognitive dissonance, being bullish on stocks and bearish on the economy. However, the gap will most certainly close. Will it be due to improving economic confidence or stocks catching down with poor economic expectations?
(Click on image to enlarge)
What To Watch Today
Earnings
- No notable earnings reports today.
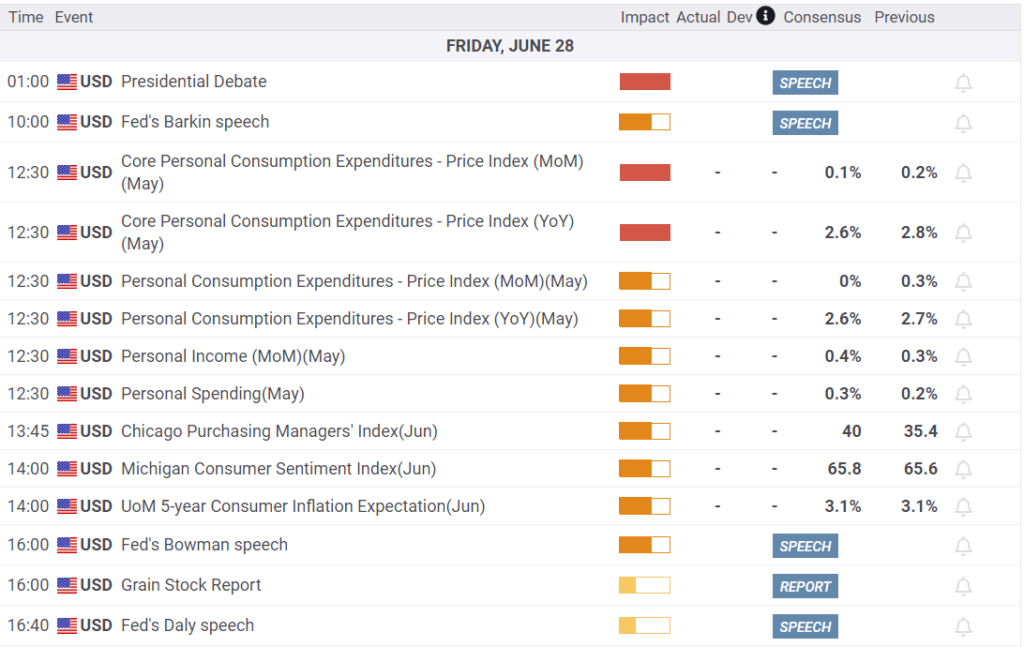
Economy
Market Trading Update
As we head into the last trading day of the month, the market remains range-bound near all-time highs. With the market still overbought, the upside remains limited near-term. However, we are close to triggering a short-term MACD “sell signal,” which further confirms that markets may be somewhat contained regarding further upside over the next week.
It has been a rather boring week of trading with little movement. Next week promises much of the same, with the July 4th holiday falling on Thursday. We expect to see a rather light trading week, but due to the lack of volume, there is a risk of a pickup in volatility.
There is little to be concerned about currently. Continue to let your equity positions play out. However, continue to follow risk-management protocols as needed to rebalance risk.
(Click on image to enlarge)

The Definition of Euphoria
While on the topic of cognitive dissonance, we think a recent segment from CNBC seems appropriate to share. On CNBC, hedge fund manager Eric Jackson of EMJ Capital stated:
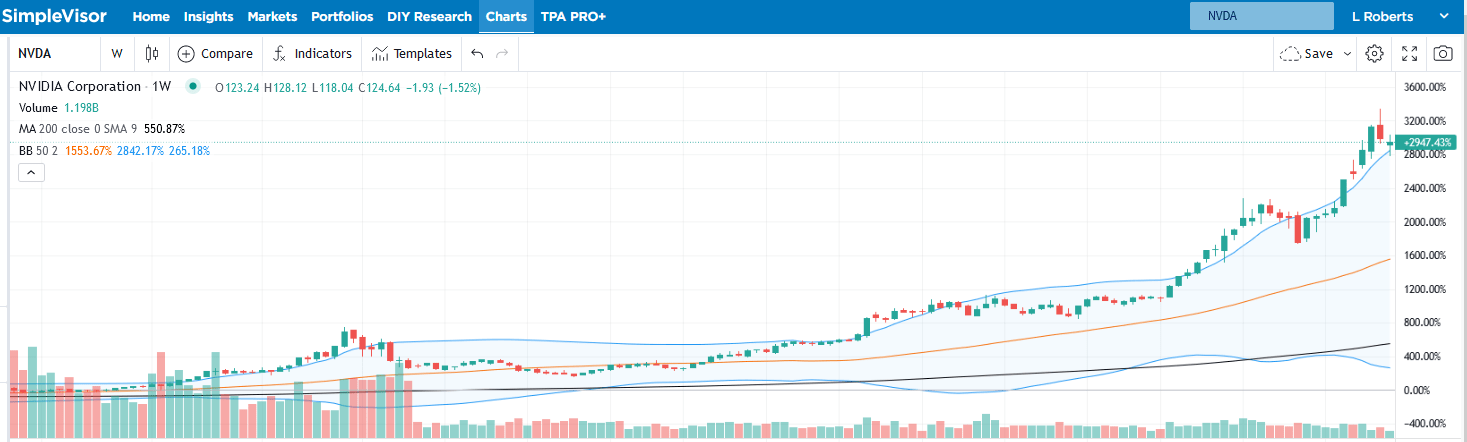
Over the last five years, Nvidia’s average look forward price to earnings multiple has been 40x. Yesterday (Monday), after this two day correction, it was 39x forward price to earnings. But there have been three times in the last five years where it had a look forward price to earnings multiple of over 50x, and two times in the last five years where it’s gotten just about to 70x and then pulled back. So we haven’t see that euphoria yet.
Jackson thinks Nvidia could have a $6 trillion valuation by the end of the year. Such means its stock price will double. He claims Nvidia investors haven’t seen euphoria yet. The stock is up nearly 3,000% in about five years, as shown below. That is euphoria! We are not sure there is a word to describe investor sentiment if Jackson proves accurate. However, stocks trading in a euphoric phase are often followed by a dysphoric feeling.
(Click on image to enlarge)
Weaker Trade Balances Accompany’s A Strong Dollar
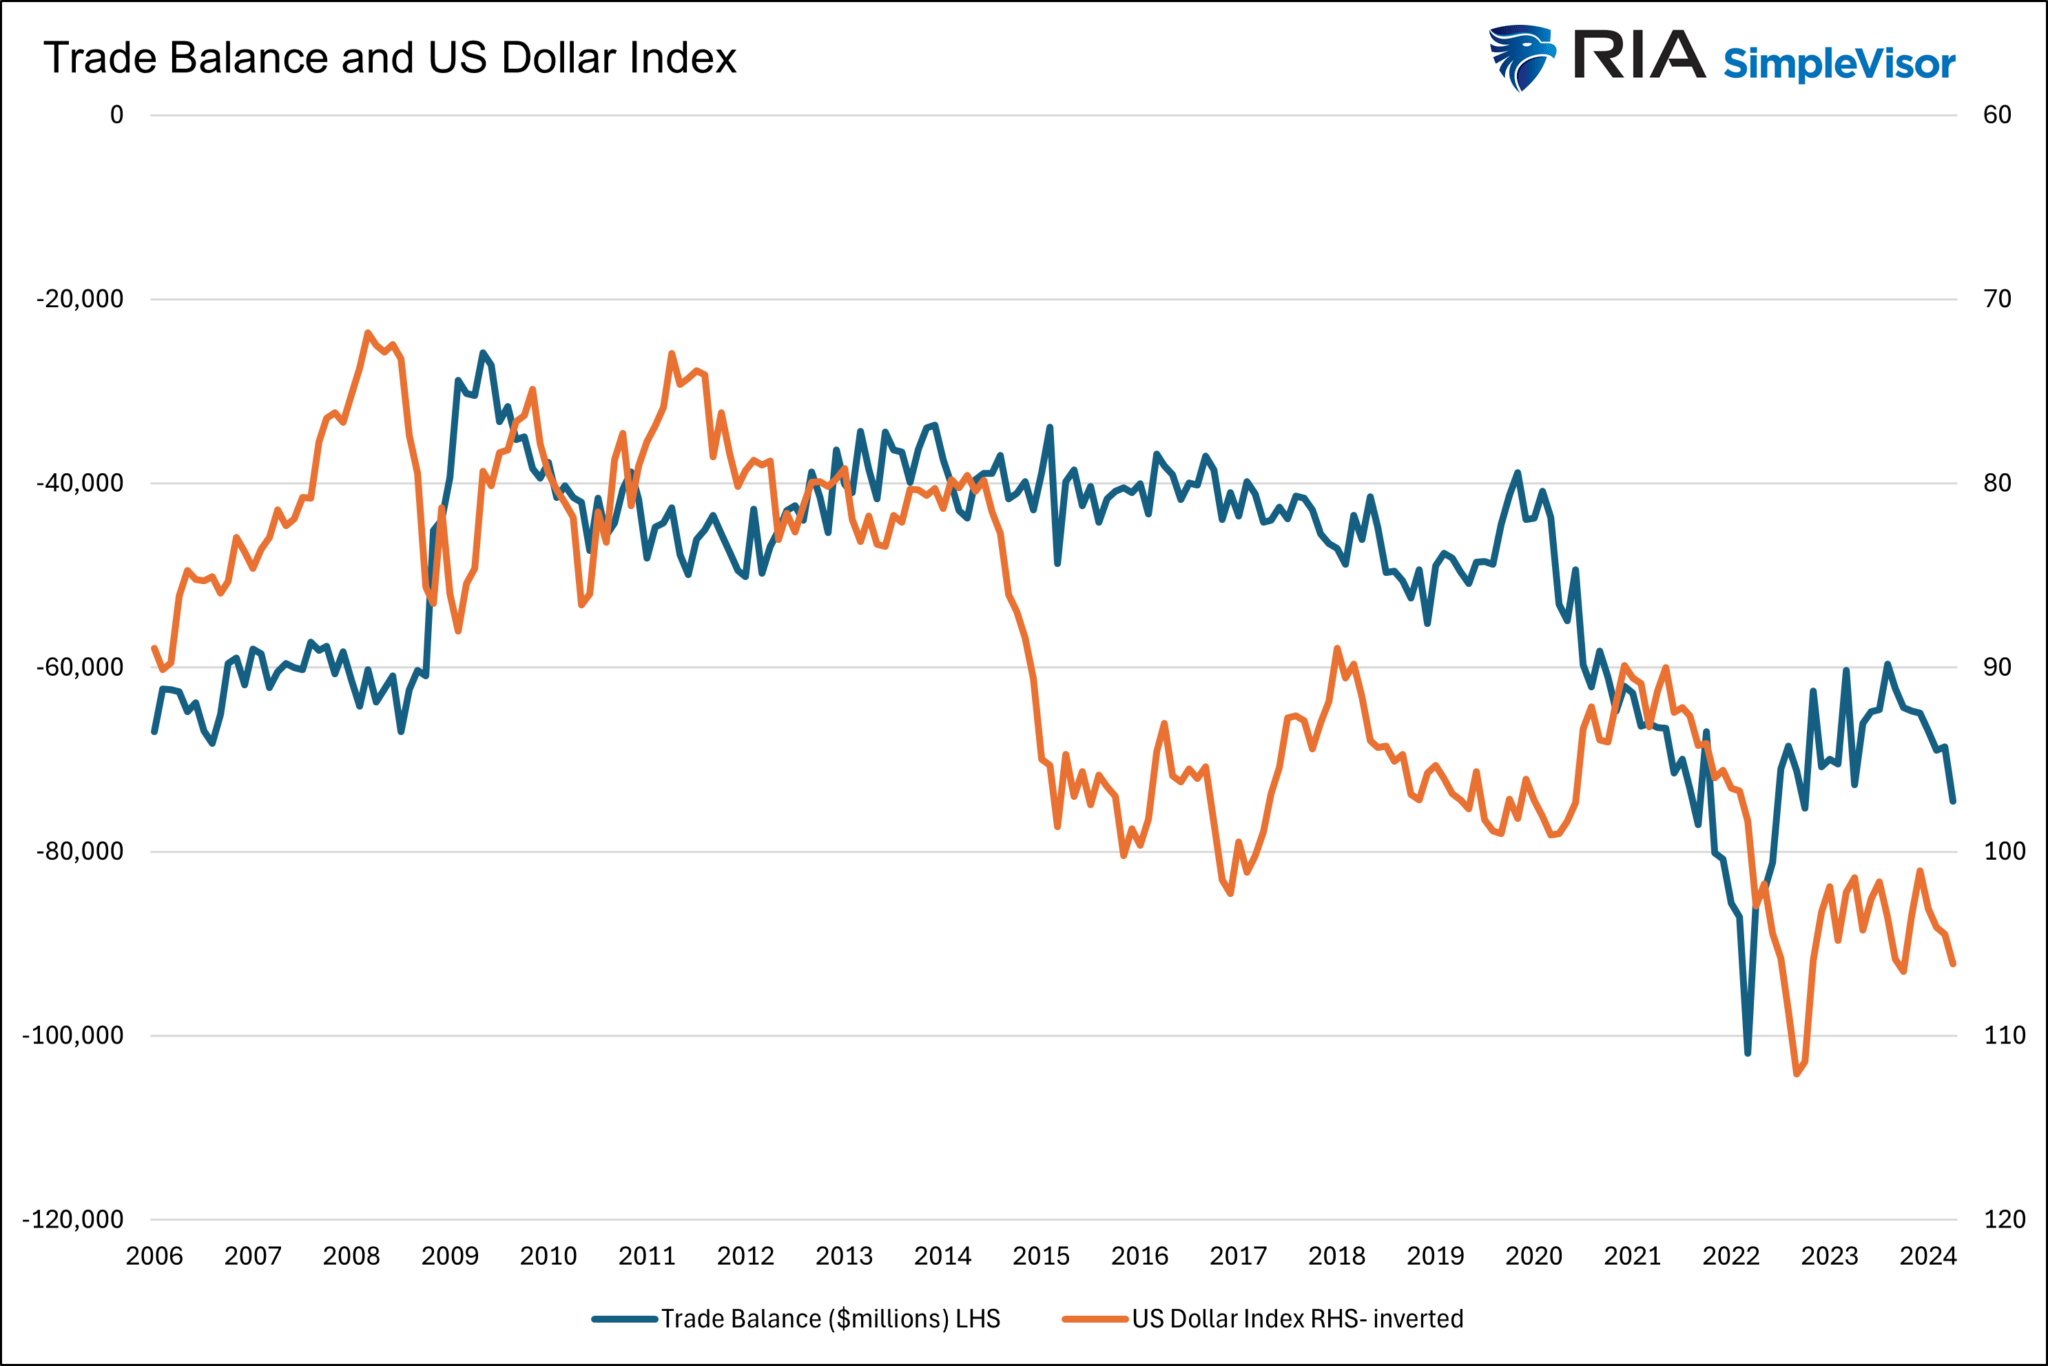
The U.S. dollar index has been up about 4% this year. A stronger dollar results in lower import prices because America runs trade deficits, i.e., we import more than we export. On the margin, trade deficits reduce prices. That is a positive. However, from a GDP perspective, it is not good news.
The formula for GDP is C+I+G+(X-M). C is consumer spending, I is business investment, G is government spending, and (X-M) is net exports. The X-M part of the formula is exports less imports. Running a trade deficit, as we consistently do, makes the net result negative. The graph below shows that trade deficits and dollar value correlate decently. Recently, dollar strength has pushed net exports further into deficit territory, thus dampening economic growth.
(Click on image to enlarge)
Tweet of the Day
(Click on image to enlarge)

More By This Author:
Will Japan Dump U.S. Treasury Securities?
Buybacks Are Back
S&P 6300? Is That Outside The Realm Of Possibility?
Disclaimer: Click here to read the full disclaimer.


