
Buybacks Are Back
Over the last six-plus months, we have written plenty on how a few stocks lead the market higher while a large majority languishes. For example, in our latest Newsletter, Bad Breadth Keeps Getting Worse, we wrote the following: “With a market sitting at all-time highs, combined with robust money flows, the breadth of the market should be healthy. However, despite the market advance, the number of stocks above their respective moving averages has declined since April.” Why is this occurring? While there are many reasons, the most impactful may be stock buybacks.
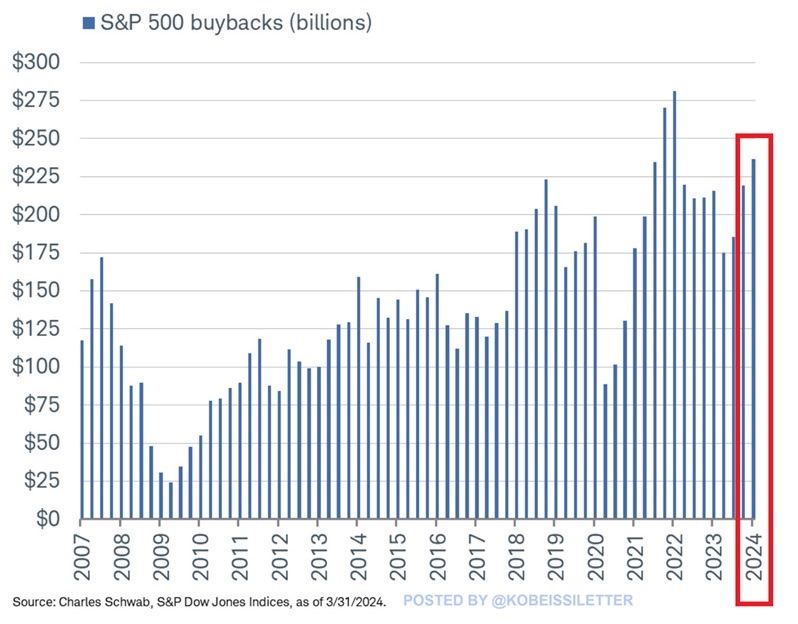
The graph below by @kobeissiletter shows that, as he highlights, $237 billion of stock buybacks occurred in the first quarter. A similar or even greater number of buybacks likely occurred this quarter ending Friday. Furthermore, Goldman Sachs forecasts $925 billion in buybacks this year and over $1 trillion in 2025. Now consider that the 20 largest companies in the S&P 500 account for slightly over half of all buybacks in the first quarter. If buybacks continue at the pace Goldman expects, it will provide a nice tailwind for the largest stocks. Therefore, the bad breadth may continue longer than many think.
What To Watch Today
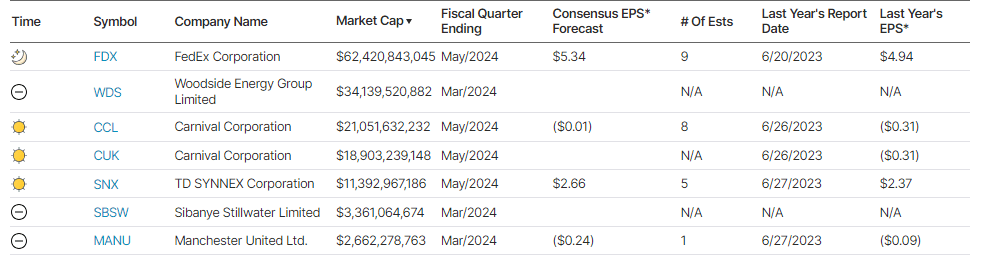
Earnings
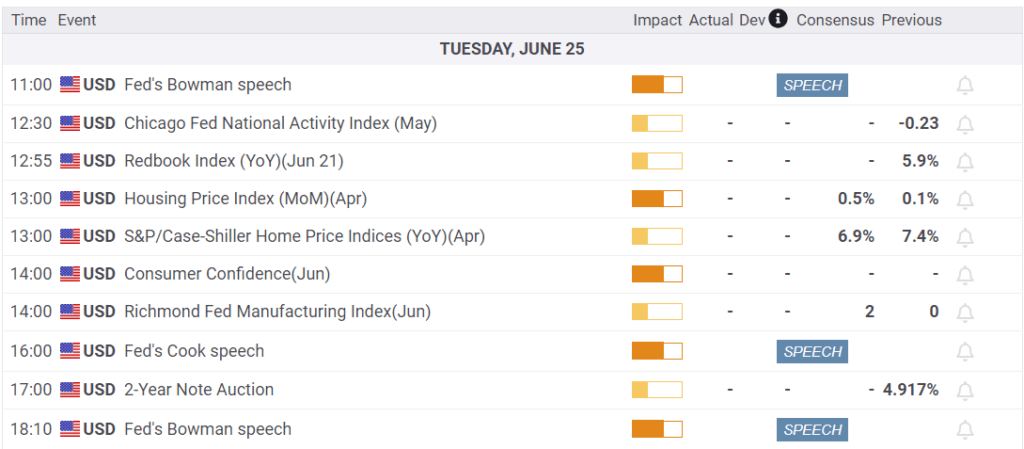
Economy
Market Trading Update
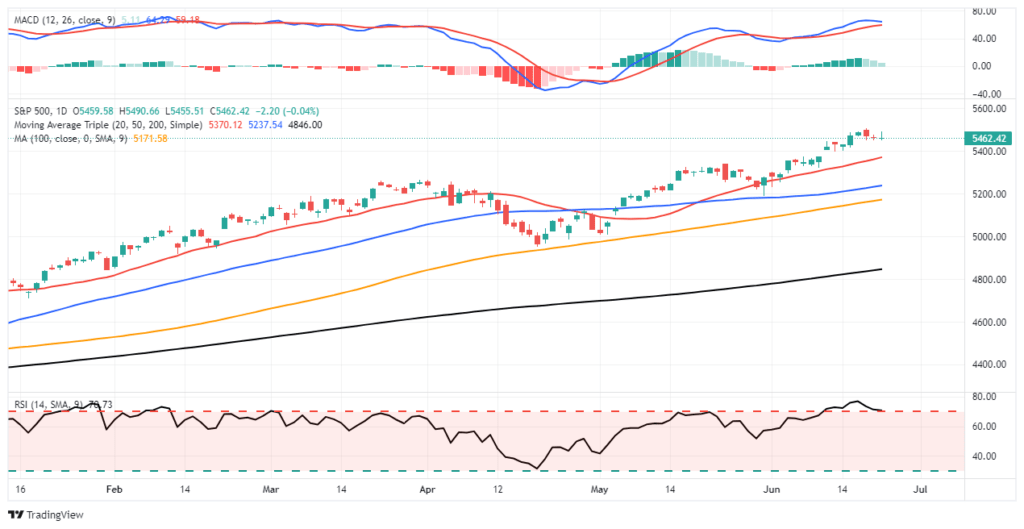
Yesterday, we touched on the negative divergences and weakening market breadth. As we noted, while these indicators suggest internal market weakness that precedes corrections historically, the timing of such an event is always problematic. One thing these internals do suggest, from a more immediate impact view, is a limited upside to the market’s advance. Over the last three days, the market has started consolidating recent gains and is working off some overbought conditions. Keep a watch on the MACD signal in the top panel. If it triggers a “sell signal,” we will see further consolidation or a correction until that signal reverses. Such a signal would give investors a better entry point for additional exposure.
The bullish trend remains intact, and investor sentiment remains very bullish. As such, continue to maintain exposure as needed, but, as always, follow risk management protocols for rebalancing as needed.
Fed Rate Cuts May Not Help The Real Estate Market
Typically, the Fed has been able to boost economic growth with lower rates. This occurs, in part, because some debtors can refinance debt at lower rates. For example, it has become commonplace to refinance a mortgage when rates fall. Lower payments, in turn, allow consumers to spend more, thus boosting economic activity.
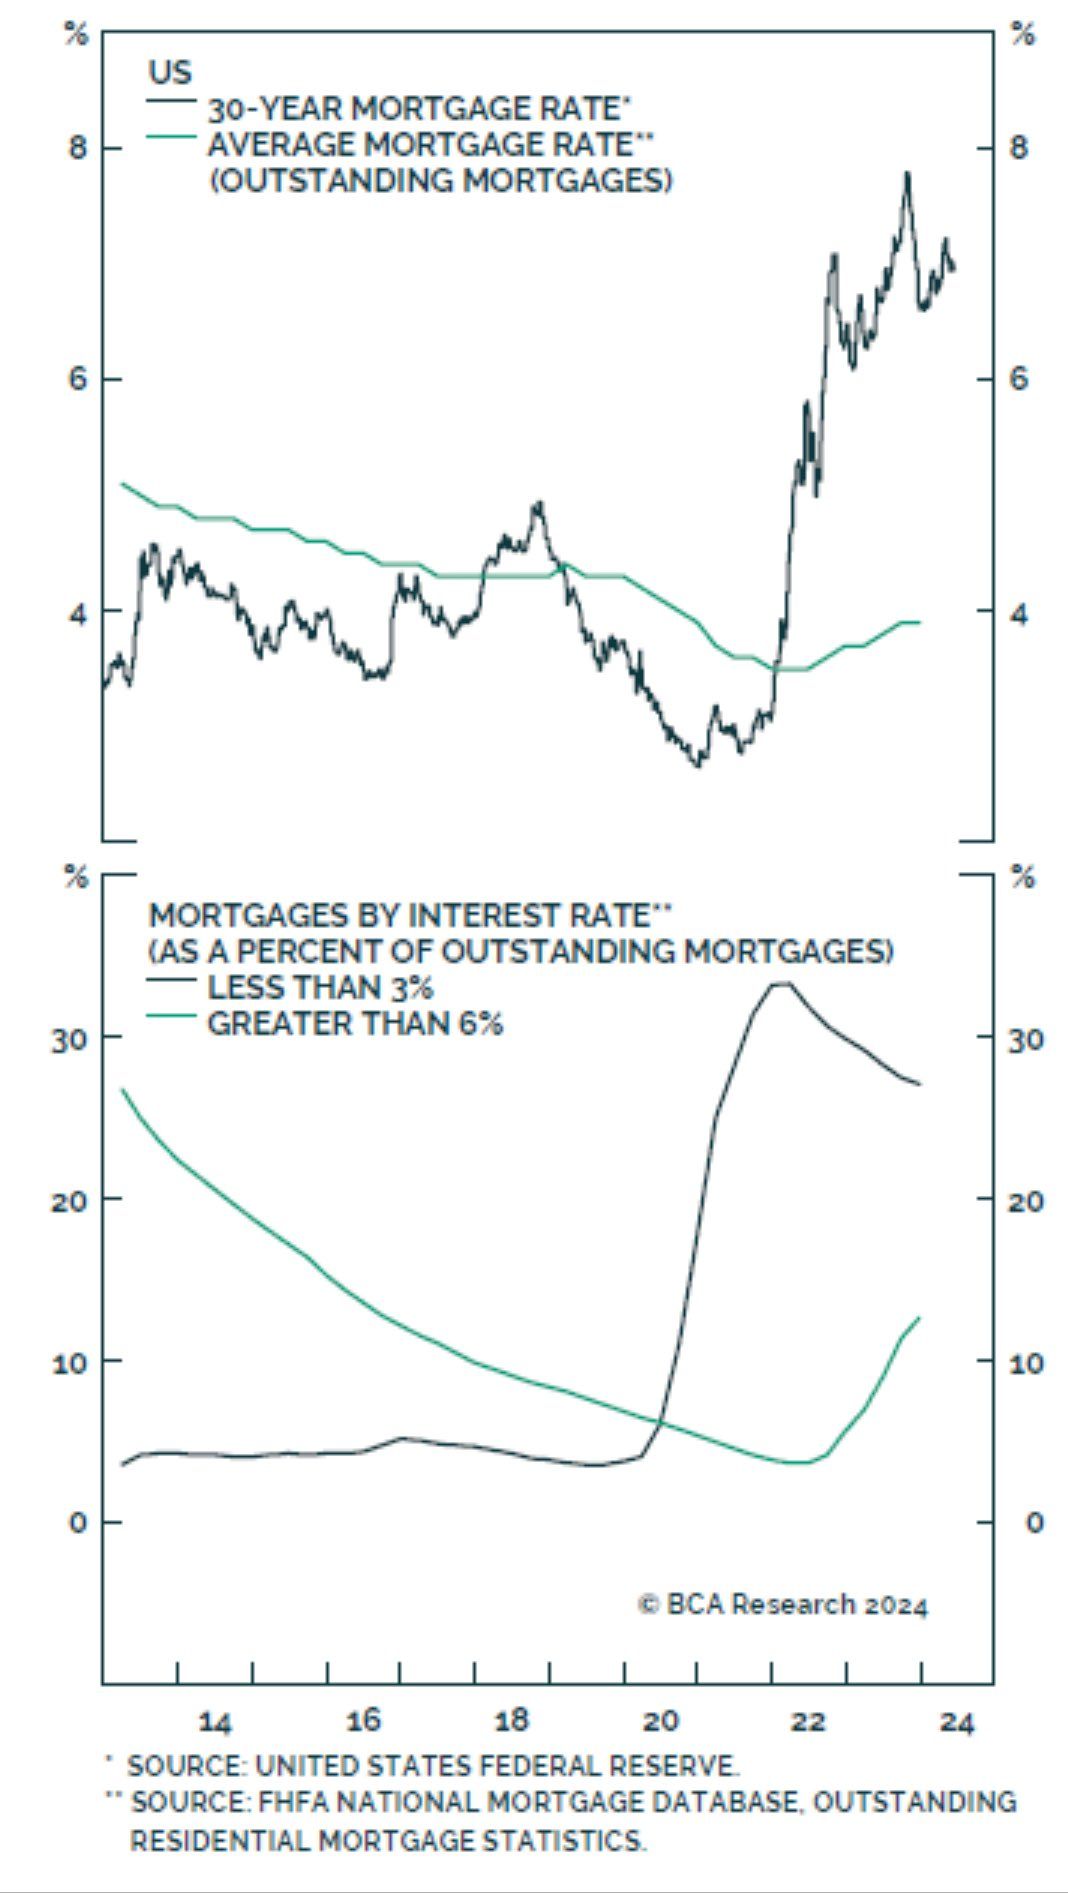
What has worked in the past may be much less effective the next time the Fed cuts rates. The top graph below, courtesy of BCA Research, shows that the average mortgage rate is still below 4%. Mortgage rates would have to drop by nearly 4% to entice the average borrower to refinance. The lower graph shows that about a third of mortgages are 3% or below. Those borrowers will need ten-year yields of near zero percent to refinance.
A similar construct exists in the business world. Many large corporations refinanced their debt in 2020 and 2021 when rates were historically low. If the Fed slowly decreases rates, it’s quite possible the benefits will be much more limited than in the past.
Relative Sector and Factor Analysis
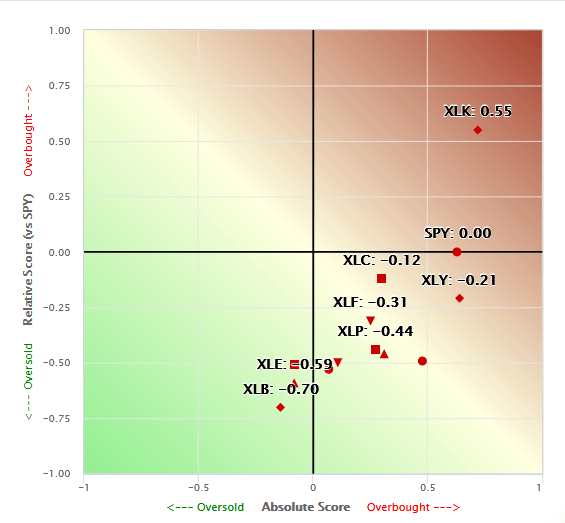
Once again, technology stocks are considerably overbought on a relative analysis. At the same time, every other sector is oversold versus the S&P 500. The first graph charts each sector’s relative and absolute SimpleVisor proprietary scores. XLK (technology) is the only sector with a relative score above zero. Many economically sensitive sectors (materials XLB, energy XLE, and XLI industrials) are very oversold.
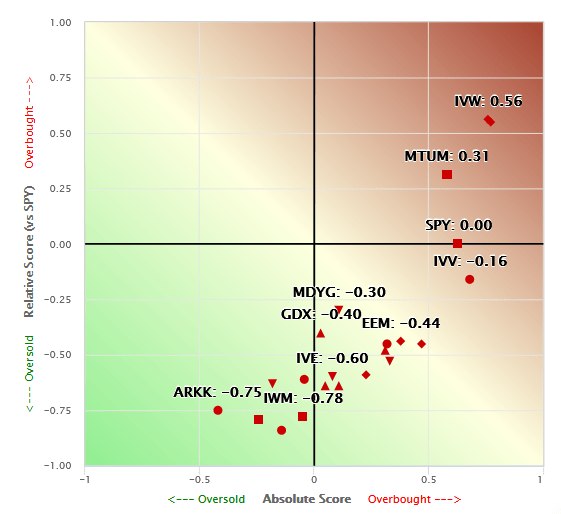
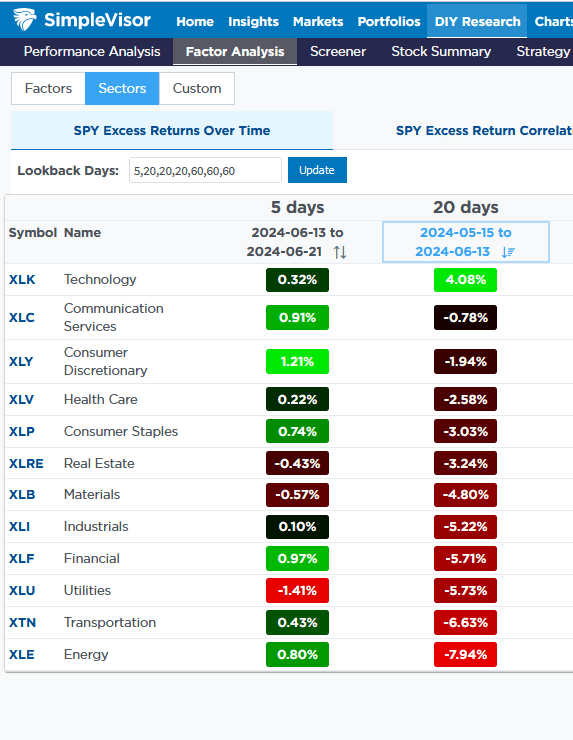
The second scatter plot using stock factors and indexes is very similar. S&P 500 Growth (IVW), Megacap Growth (MGK), and Momentum (MTUM) are the only factors with positive relative scores. Many other factors are grossly oversold. The two most oversold are foreign markets (EFA and VEA). The third table shows that XLK is up 4.08% over the last four weeks. Conversely, every other sector is lower over the period. Furthermore, half of the sectors are down by 5% or more.
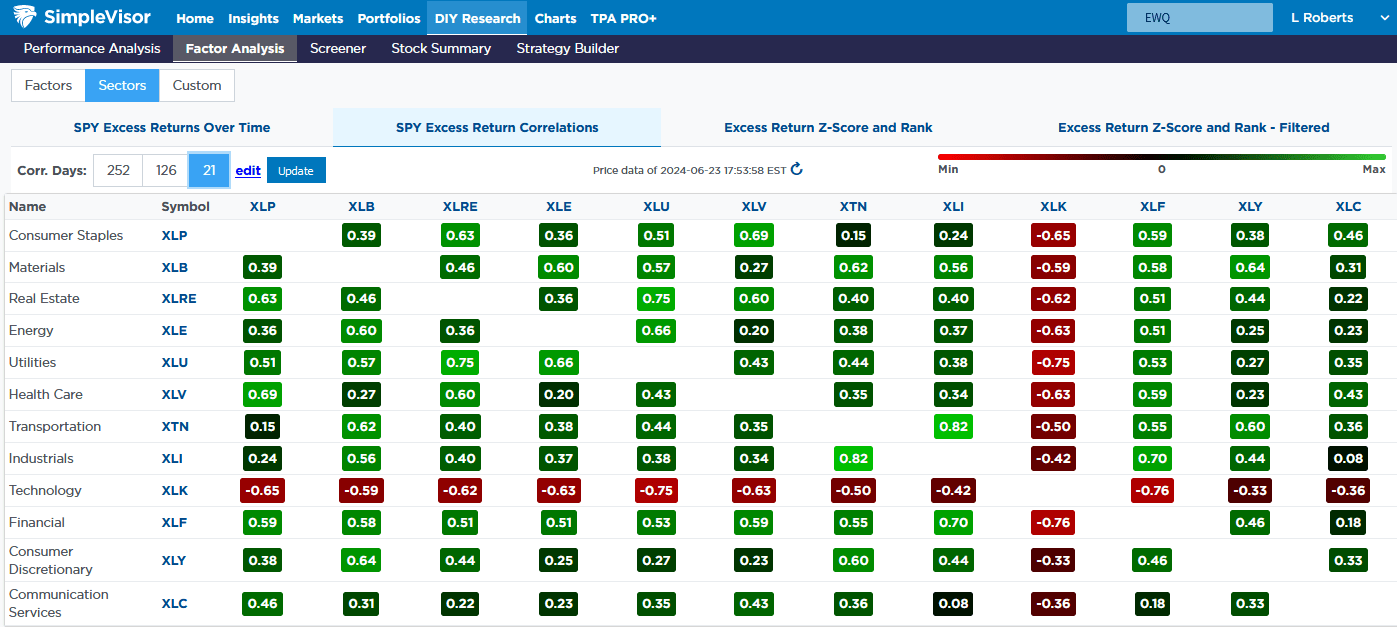
Lastly, the fourth table shows the price correlations of each sector versus every other sector for the last 21 days. XLK has a negative correlation to every sector, while every other sector is positively correlated to each other. The set of images below helps better appreciate the horrendous market breadth.
(Click on image to enlarge)
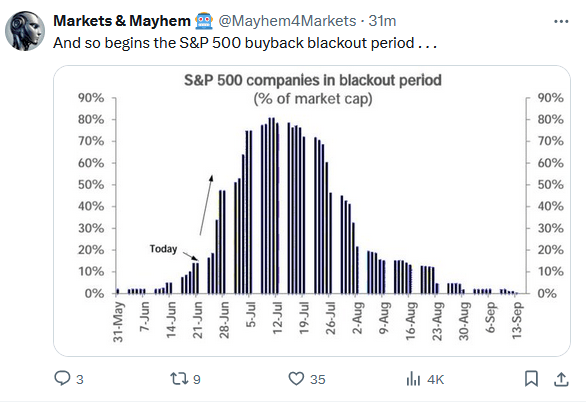
Tweet of the Day
More By This Author:
S&P 6300? Is That Outside The Realm Of Possibility?Bad Breadth Keeps Getting Worse
Communication Data Implies Remote Work is Here to Stay
Disclaimer: Click here to read the full disclaimer.


