

Image Source: Pixabay
Japan holds $1.150 trillion of U.S. Treasury securities, well above the next major foreign holder, China, which has $770 billion. Therefore, given Japan holds 3.3% of all Treasury debt, it is worth appreciating the recent news that Japan is selling bonds. First, to dispel some fear, Nornichukin Bank, not the Bank of Japan or the Japanese government, is selling U.S. Treasury bonds. Their goal is to sell $63 billion of U.S. and European government bonds by March 2025. Importantly, this is not a government policy decision but one the bank is making to fortify its deteriorating balance sheet. According to SIFMA, $879.8 billion Treasuries trade daily on average. With 262 days to sell less than $63 billion, their actions should have zero impact on Treasury yields.
However, persistent rumors have been circulating for years that the Japanese government and/or BOJ will sell bonds to prop up its currency. The yen has been in a free fall recently. On Wednesday morning, it traded at levels last seen in 1986! To appreciate Japan’s dilemma of selling Treasuries, providing it with dollars in which to buy the yen, consider a quote we wrote two years ago (LINK):
“However, as the BOJ tries to stop rates from rising, they weaken the yen. Japan is in a trap. They can protect interest rates or the yen, but not both. Further, its actions are circular. As the yen depreciates, inflation increases, and the Japanese central bank must do even more QE to keep interest rates capped.”
The cartoon below helps answer our question. Selling Treasuries in large quantities to support the yen risks increasing interest rates, which can increase the odds of insolvency.
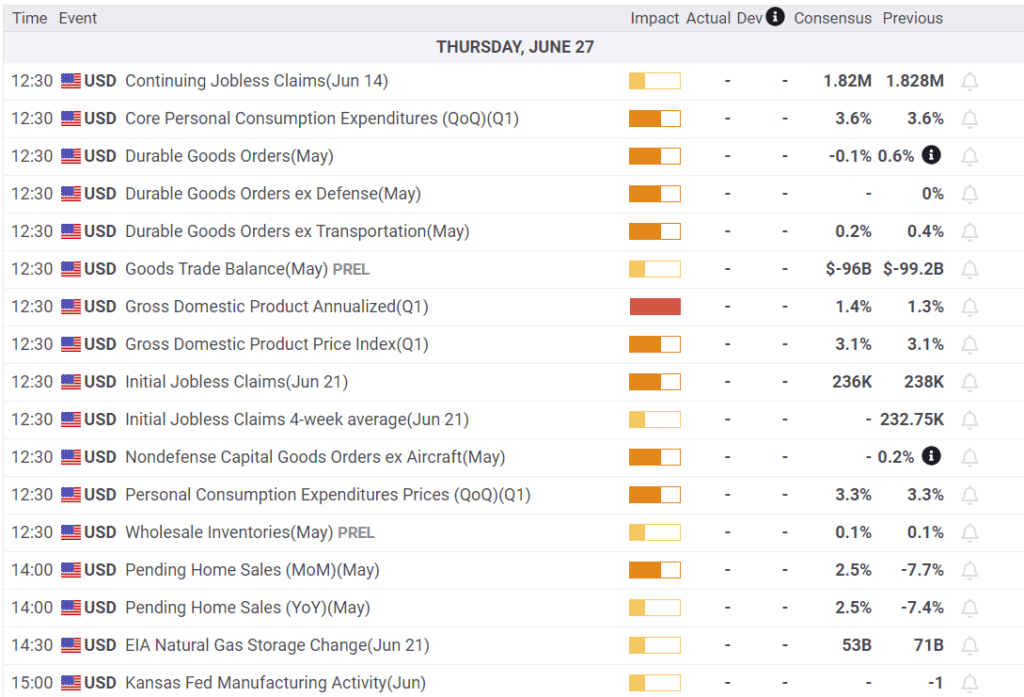
What To Watch Today
Earnings

Economy
Market Trading Update
As discussed yesterday, the market was under pressure recently due to the decline in Nvidia (NVDA). However, that sell-off seems to have abated for now, and there has been little other data to move the market as we head into the month’s end. Since this is the second quarter’s end, portfolio managers must rebalance their holdings by Friday. Furthermore, next week is shortened by the July 4th holiday, so trading will be light. Today and tomorrow are full of economic data that will be eyed closely for further clues to the upcoming Federal Reserve meeting in July. Furthermore, next week starts the beginning of the Q2 earnings season.
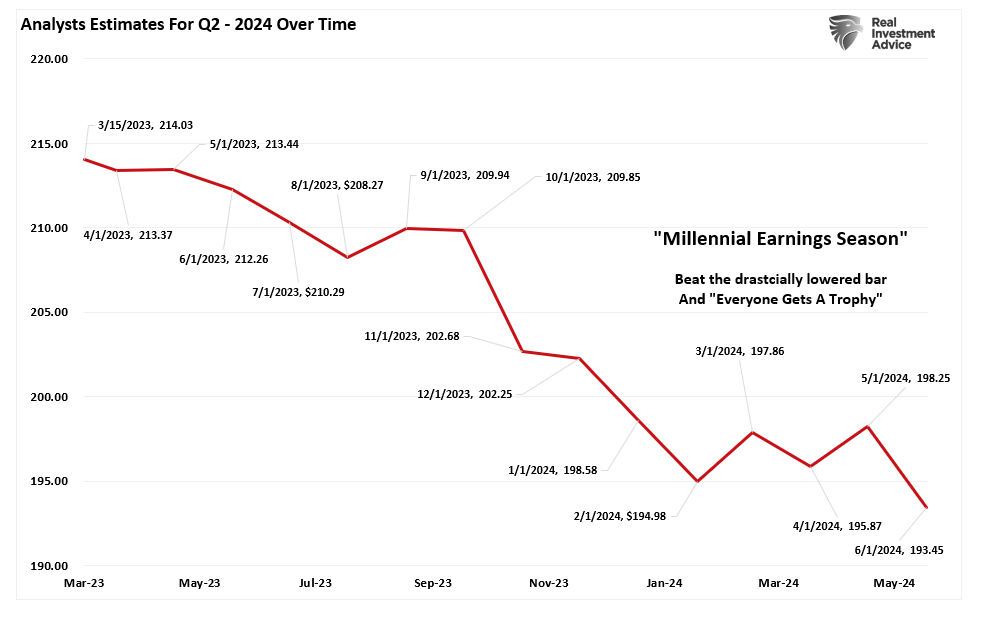
Speaking of earnings season, analysts have slashed estimates over the last 30 days. Despite ratcheting their views on the market outlook, with Goldman Sachs leading the way at 6300 by year-end, analysts reduced estimates from $198.25 to $193.45. That is the lowest estimate for this quarter since last year, when they started at $214.03.
As noted, this is why we call it “MIllennial Earnings Season,” as analysts keep lowering the bar until “everyone gets a trophy.”
Small Cap Stocks Are Relatively Cheap
Much of the recent market conversation revolves around the strength of large-cap stocks and the relative weakness of most other stocks. What is not often heard is how the performance is affecting valuations. The graph below, courtesy of Yardeni Research, shows that the forward P/E ratio for large-cap stocks is near the highest level since the dot com bust. Yet, the forward P/E for small and mid-cap stocks has been lingering at their lowest levels in over ten years. More importantly, the current valuation has been the lowest since 2008, excluding periods when the market was in a correction. The gap between large and small-cap stocks will likely converge at some point. However, it can get more dislocated before such a normalization occurs.

Office Carnage Continues
The price decline of some office properties in many major cities is startling. We follow @TripleNetInvest on X/Twitter to keep us updated on commercial real estate fire sales. On Wednesday, he posted the following:
An office tower (pictured below) in San Francisco’s Mid Market area shockingly sold for 90% LESS than what it last traded for.
The previous owner paid $62M in 2018 for the 90k SF building.
It was recently acquired by a Starwood affiliate for $6.5M ($72 per SF)
Despite the post-Covid normalization across most economic sectors, vacancy rates around the country are not falling. San Francisco has the highest vacancy rate of big cities, at 37%. For context, it was 7% in 2019. Furthermore, it has an occupancy rate of 44%. Per Optimize Reality:
As those drastically under-occupied leases come due, they will exaggerate an already market clogged by empty office space. The over-saturation will become far worse indicated already by dropping rents and hundreds of thousands of square feet hitting the sublease market.
Tweet of the Day

More By This Author:
Buybacks Are BackS&P 6300? Is That Outside The Realm Of Possibility?
Bad Breadth Keeps Getting Worse


Comments
Log in or sign up to join the conversation.