
Until 8:30 Friday morning, the consensus firmed believed in Goldilocks. July’s weaker-than-expected jobs report quickly changed this into heightened odds of a recession. How this shakes out in the sessions ahead will be telling. If the bulls are still in command, there is a case for a relief rally. But in a scenario in which this fails to materialize, one has to conclude this sell-off is different.
The July jobs report threw the equity bulls a curve ball. Last month, 114,000 non-farm jobs were created – much less than expected. The gains were nothing to sneeze at, but the trend is deteriorating. In the last four months, this was the third sub-200,000 month.
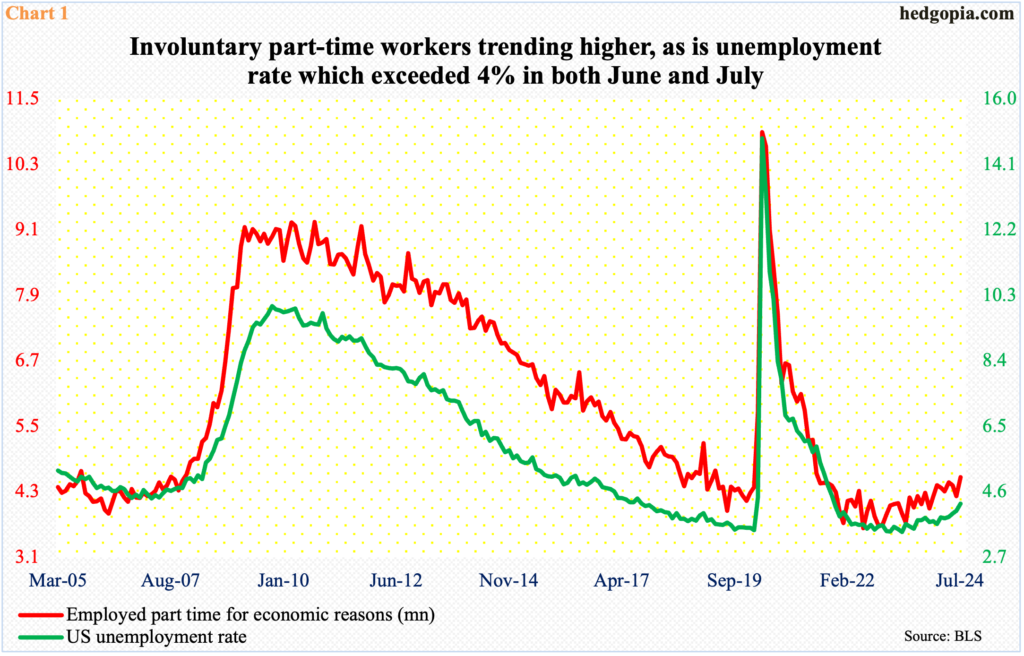
More worryingly, the unemployment rate increased two-tenths of a percentage point month-over-month to 4.25 percent (Chart 1). In April last year, the unemployment rate reached a 54-year low of 3.43 percent. Historically still very low, this was the second consecutive month of north of four percent. For the technically oriented, the unemployment rate has bottomed – a la a saucer bottom.
Concurrently, involuntary part-time workers jumped 346,000 m/m to 4.57 million. In June 2022, the metric reached a record low 3.63 million and was at 3.74 million in May last year.
Suddenly, there is growth scare. Until now, the consensus was heavily leaning on Goldilocks.
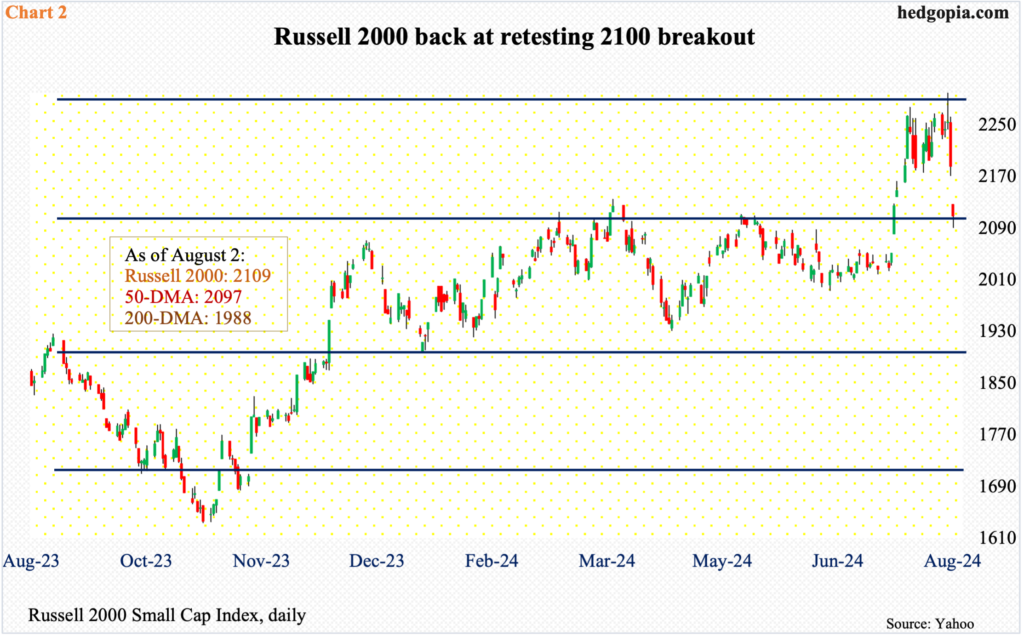
Nowhere was this scare more evident than in the small-caps last Friday. The Russell 2000 tumbled 3.5 percent to 2109, having tagged 2091 intraday; for the week, the small-cap index gave back 6.7 percent. Of course, this followed a massive 15-session surge.
On July 10th, the Russell 2000 closed at 2052. On the 11th, June’s CPI (consumer price index) came out, which confirmed the prevailing disinflation trend. Markets immediately reacted by pricing in the beginning of an easing cycle with a cut in September. The assumption was that lower interest rates would not only help the balance sheet of leveraged small-cap companies but that this would translate to a better income statement by ensuring the economy does not slide into a recession. By last Wednesday, the Russell 2000 ticked 2300 intraday. Then came Friday’s jobs report, and money fled the small-caps, which previously benefited from a rotation away from tech.
Friday’s close just north of 2100 gives the small-cap bulls an opportunity to prove the recent rally was not just a fluke – by stepping up and defending 2100.
The index has had difficulty reclaiming 2100 going back to early March (Chart 3). Additionally, 2144 represents a 61.8-percent Fibonacci retracement of the drop between the November 2021 peak (2459) and the June 2022 trough (1641); 2100 also represents a measured-move price target post-breakout at 1900 last December, as the index was trapped between 1700 and 1900 going back to January 2022.
Inability to save 2100 will open the door toward 2000 initially and then 1900. This will have telegraphed to the markets that the economy was headed for trouble. By nature, small-caps have a larger exposure to the domestic economy than their large-cap cousins.
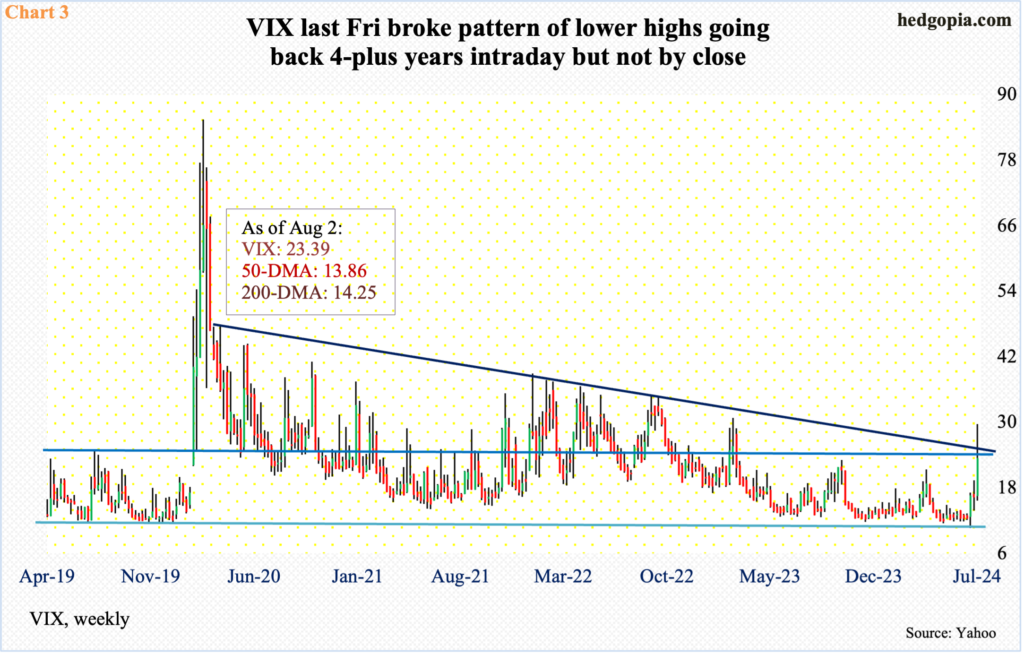
Apart from the small-caps, the surge in volatility was another indication of incipient investor fear. Markets were way complacent until now. As recently as July 19th, VIX fell as low as 10.62 intraday. Last Friday, it tagged 29.66, although the fact remains that the volatility bulls failed to hang on to all of it, closing at 23.39.
For now, 25 is worth a watch. This not only represents horizontal resistance but also trendline resistance from the early months of 2020 (Chart 3).
The way Friday closed, VIX left behind a large upper wick. Several times in the past, VIX has shown a tendency to go the other way after a spike reversal. It is too soon to declare Friday’s candle as such, but if it turns out that way and VIX comes under pressure near-term, 19 should hold. If instead the volatility index rallies, the four-plus-year trendline is the one to watch.
A case can be made that VIX has gone too far too fast for now and needs a reprieve.
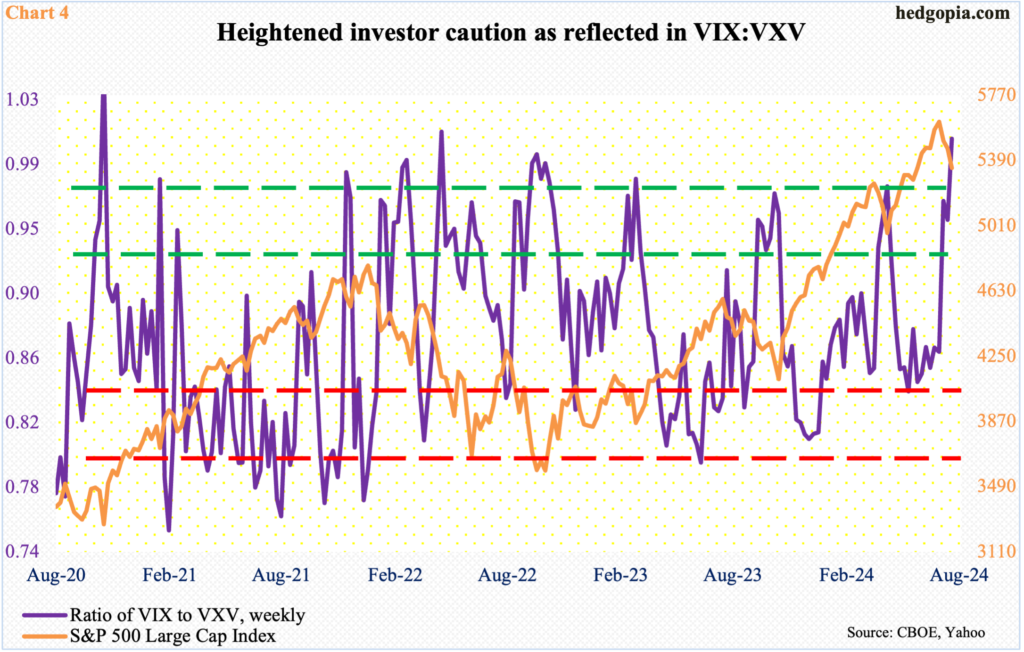
VIX measures market’s expectation of 30-day volatility based on S&P 500 index options. VXV does the same, except it goes out to three months. When the investing climate is risk-on, as has been the case for a while now, demand for VIX-derived securities is lower than, let us say, VXV. The opposite is true when investor sentiment wanes.
Last week, VIX:VXV closed at one (Chart 4). The last time the ratio reached unity was in April 2022. Ordinarily, the ratio tends to come under pressure once it reaches .90s or higher. But there are exceptions. Even in April 2022, after crossing one, the ratio came under slight pressure but stayed in the .90s most of the time until the S&P 500 bottomed in October. A scenario of elevated readings for weeks or months cannot be ruled out, given how quickly the narrative has changed from Goldilocks to recession.
In the event the ratio of VIX to VXV proceeds to unwind the overbought condition it is in, it will of course help the S&P 500. In this scenario, we can make a case for a relief rally.
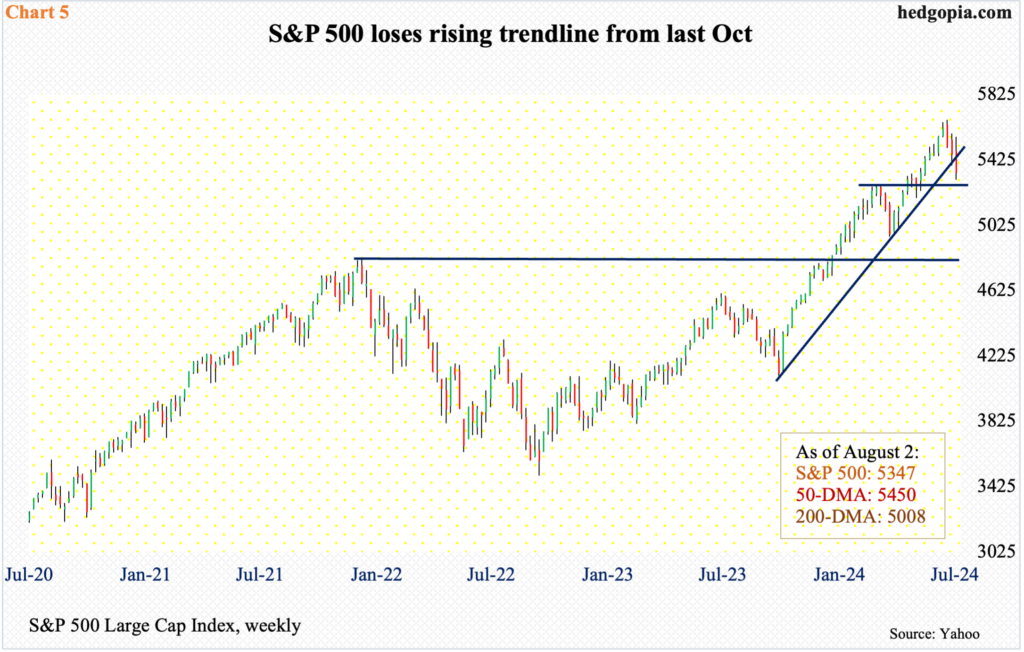
With that said, mid-to long-term, the large cap index is a long way from putting in a sustainable bottom. From the July 16th new record of 5670 through last Friday’s low of 5302, it dropped 6.5 percent. This was preceded by a 38.2-percent surge from last October’s low.
Several monthly indicators in particular have just begun to turn lower from overbought levels and can continue lower. Last Friday’s low just slightly breached horizontal support at 5320s, but was saved by close, as the index closed at 5347. Inability to defend 5320s will expose the index to another layer of support at 5260s. As I write this, futures are down 2.8 percent. If this sticks by close, then there is not much before the 200-day gets tested at 5008. A rising trendline from last October has already been breached (Chart 5).
When it is all said and done, breakout retest at 4810s will occur at some point. This was a high from January 2022, and it took another two years before the bulls broke out of it this January.
More By This Author:
Reading The Future With Futures: Latest CoT ReportNasdaq 100-Russell 2000 Ratio Approaching Crucial Retest; Small-Cap Bulls Should Hope For Breach
Fortune-Telling With Futures - What Positions Noncommercials, Hedge Funds Are Taking


Comments
Log in or sign up to join the conversation.