
Following futures positions of non-commercials are as of July 30, 2024.
10-year note: Currently net short 728.5k, up 86.5k.
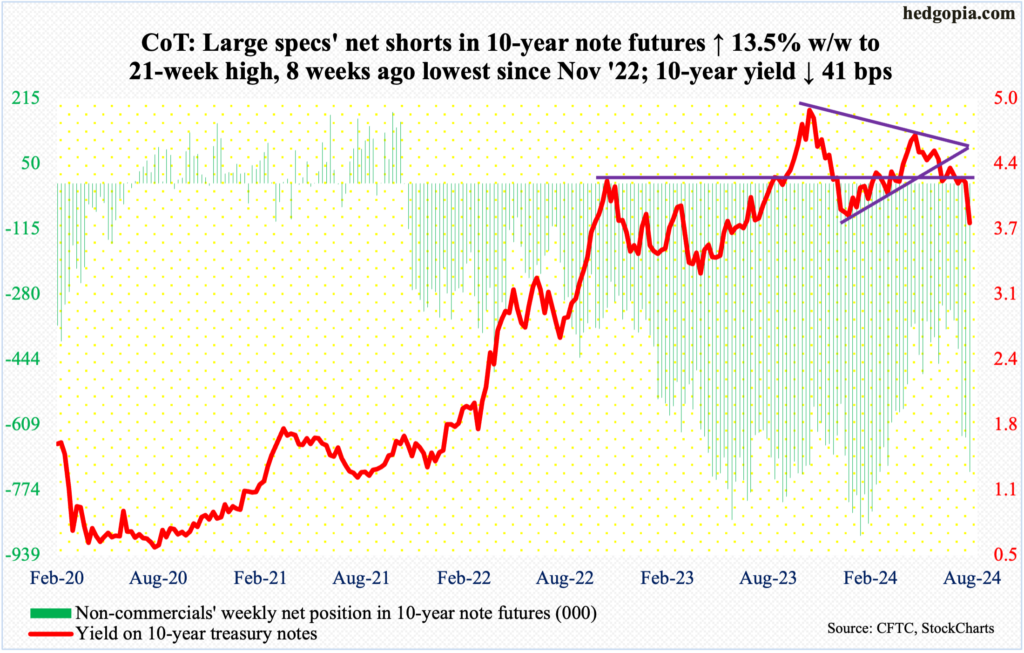
July’s jobs report was weaker than expected, with a gain of 114,000 non-farm jobs and the unemployment rate jumping to 4.3 percent. This totally turned the interest-rate outlook on its head. For the week, the 10-year treasury yield gave back 41 basis points to 3.79 percent, even as futures traders priced in eight 25-basis-point cuts between the upcoming September meeting and September next year.
We suddenly have a growth scare. The 525-basis-point tightening in the fed funds rate between March 2022 and July 2023 is beginning to impact the economy – adversely, of course. The problem for the Federal Reserve is that inflation has come down a lot from the four-decade highs of 2022 but remains well above the two percent goal. This is likely to constrain their hands.
Post-jobs report on Friday, there were even calls for a 50-basis-point cut in September. If this ends up being the consensus, Jerome Powell and team are likely to push back against that; if they comply, that would most likely be viewed as panic and will not be treated well in the markets.
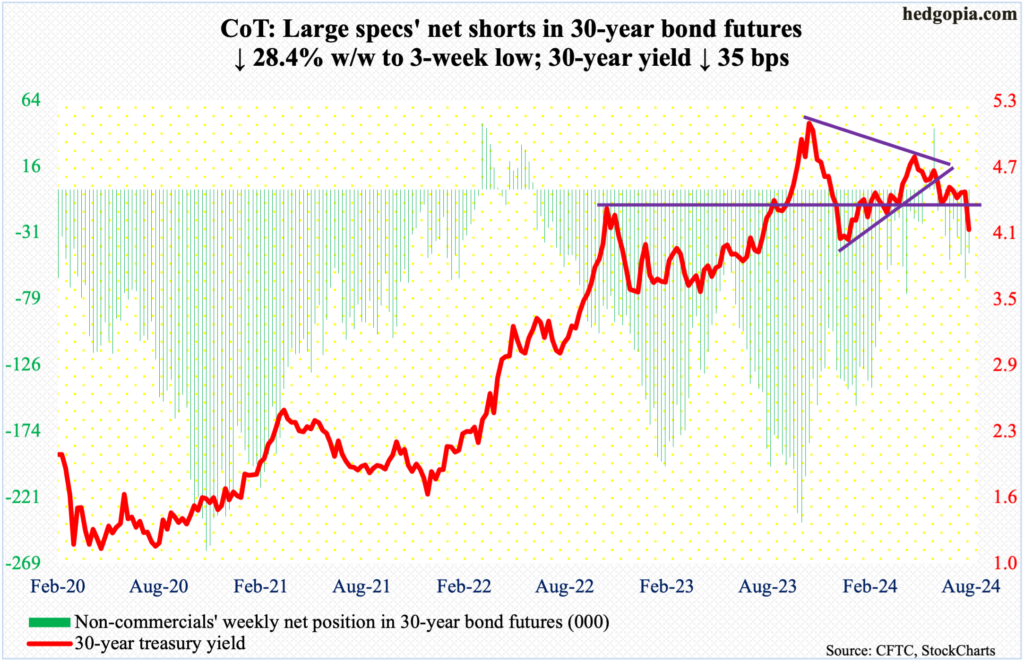
30-year bond: Currently net short 45.9k, down 18.2k.
Major US economic releases for next week are as follows.
The ISM services index (July) is on deck for Monday. In June, non-manufacturing activity dropped five percentage points month-over-month to 48.8 percent. Over 49 percent, the metric generally indicates that the economy is expanding. The June reading thus suggests contraction in economic activity, which is occurring for the first time in 17 months.
Wednesday brings consumer credit (June). Consumer credit grew 2.1 percent year-over-year in May to $5.1 trillion (seasonally adjusted) – a new record. Of this, revolving credit surged 6.7 percent to $1.3 trillion – also a new record; non-revolving edged up 0.5 percent to $3.7 trillion, which is just a tad lower than a record high set in July last year.
WTI crude oil: Currently net long 247.2k, down 39.6k.
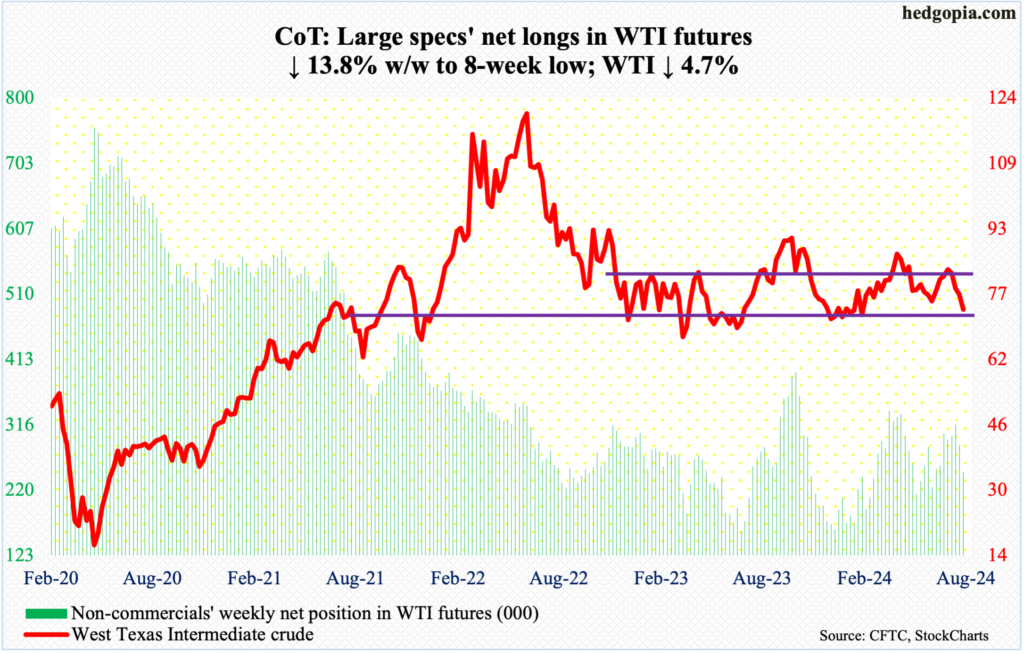
West Texas Intermediate crude tumbled 4.7 percent this week to $73.52/barrel. After rallying for four weeks in a row and peaking at $84.52 on July 5th, this was the fourth consecutive week of decline.
This week’s drop followed several unsuccessful attempts last week – as well as this week – to reclaim the 200-day moving average ($78.40). Thursday, the crude tagged $78.88 intraday before reversing lower hard; Friday was even worse. With this, WTI has fallen at the low end of a months-long range between $71-$72 and $81-$82. This support is unlikely to give way right away.
In the meantime, US crude production in the week to July 26th was unchanged at record 13.3 million barrels per day for the fourth week in a row; the level was previously hit seven times from last December to February. Crude imports increased 82,000 b/d to seven mb/d. As did stocks of distillates, which grew 1.5 million barrels to 126.8 million barrels. Stocks of crude and gasoline, however, fell 3.4 million barrels and 3.7 million barrels respectively to 433 million barrels and 223.8 million barrels. Refinery utilization decreased 1.5 percentage points to 90.1 percent.
E-mini S&P 500: Currently net long 12k, up 25.2k.
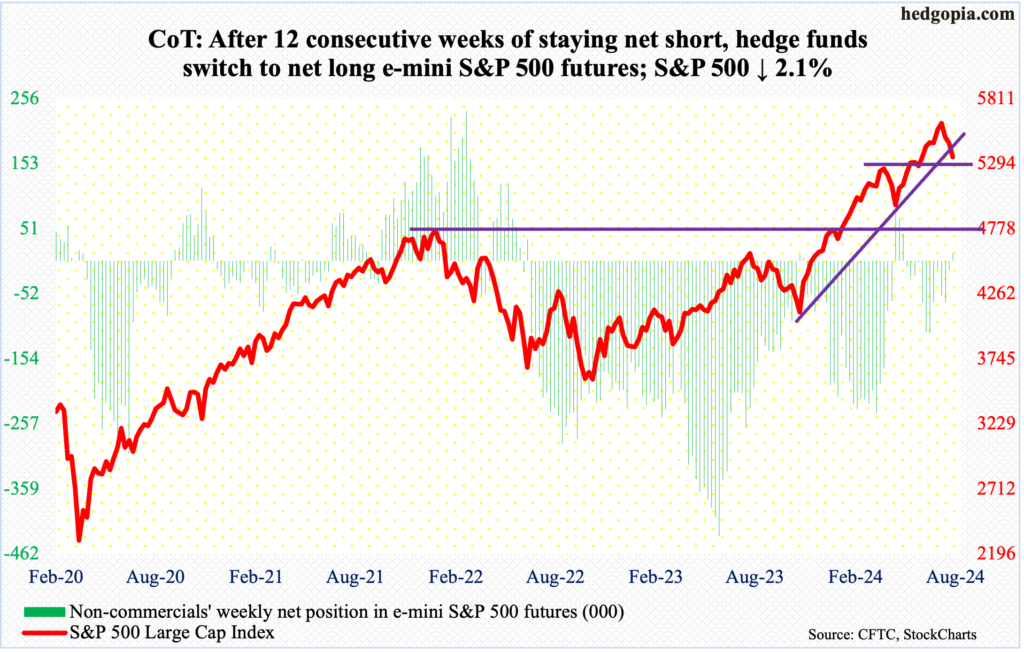
Non-commercials are now net long. Before this, they were net short for 12 consecutive weeks. On Tuesday, the S&P 500 finished at 5436, just under the 50-day (5450). By Friday, the large cap index closed at 5347, with an intraday tag of 5302. From the July 16th high of 5670 through Friday’s low, the index gave back 6.5 percent. This is nothing in the big scheme of things, as the S&P 500 jumped 38.2 percent from last October’s low before coming under pressure.
On the monthly, indicators are just beginning to come under pressure, so there is a long way to go on the downside. The rising trendline from last October has been compromised.
For now, a relief rally is possible. Friday’s low just slightly breached horizontal support at 5320s, but was saved by close. In the event the bulls are unable to defend this, there is another layer of support at 5260s.
Euro: Currently net long 17.8k, down 18.1k.
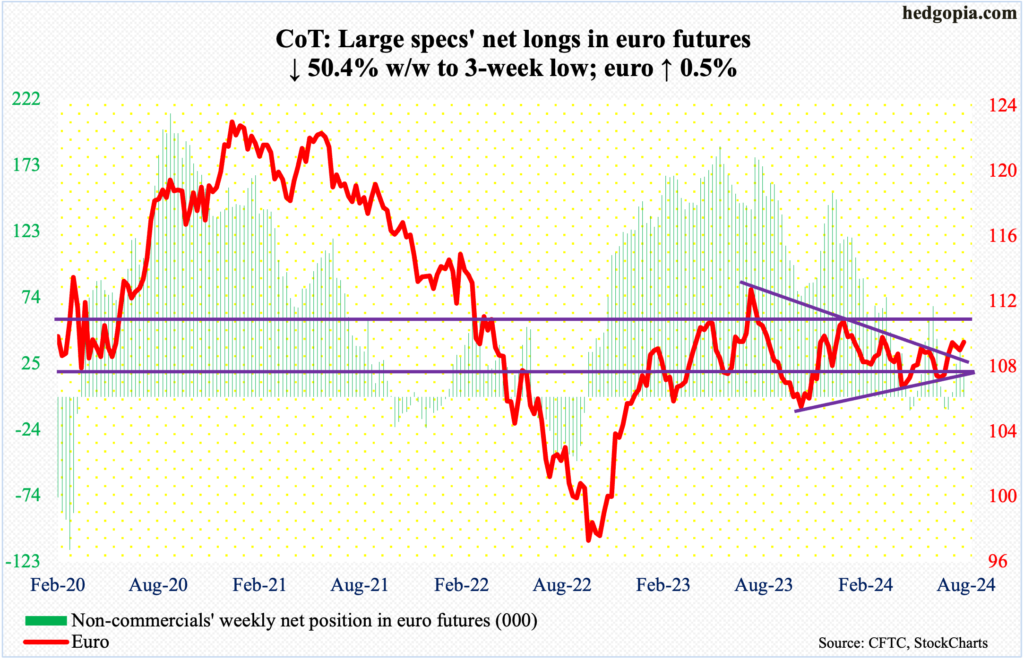
Aided by Friday’s 1.2-percent surge, the euro rallied 0.5 percent this week to $1.091. Euro bulls nevertheless have a hurdle ahead.
Three weeks ago, after rallying for as many weeks, the euro formed a weekly gravestone doji right on trendline resistance from last July when it topped at $1.128. This week’s high of $1.093 just about tested that resistance at $1.095. Unless a breakout occurs, the currency could be headed toward trendline support from last October when it bottomed at $1.045; this support lies at $1.07.
Gold: Currently net long 246.6k, down 26.5k.
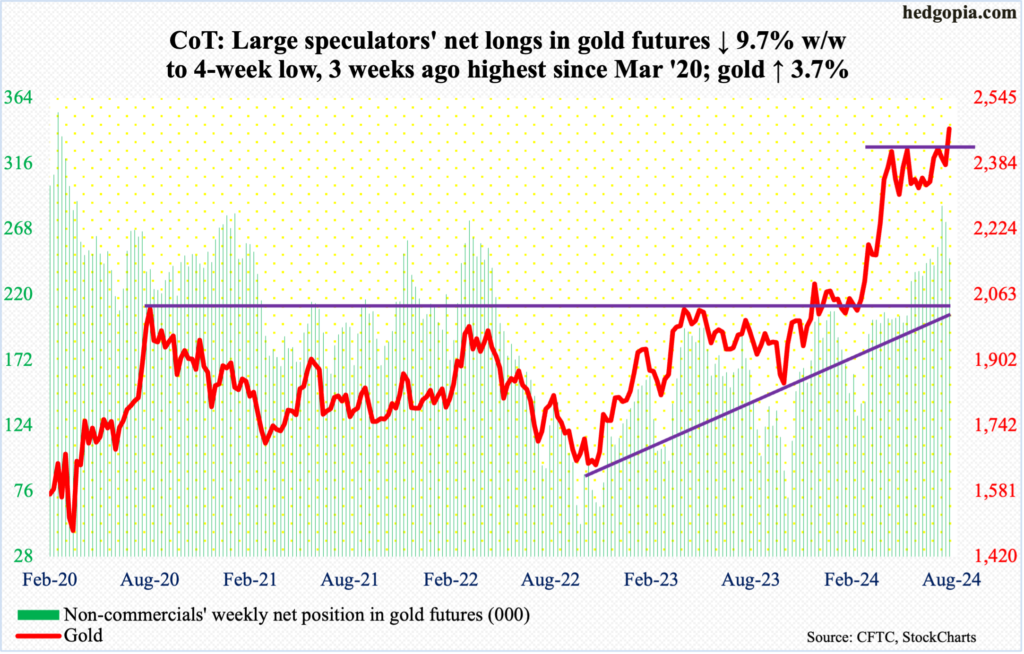
On April 12th, gold hit a new intraday high of $2,449 before selling off a tad. This was eclipsed on May 20th, as the yellow metal ticked $2,454 before once again coming under pressure. All along, bids showed up at $2,300. Then on July 17th, gold tagged $2,488; this was a breakout that came after three months of sideways move, but unfortunately for gold bugs the metal immediately came under pressure.
Once again, gold hit a new intraday high of $2,523 this Friday, but only to close at $2,470/ounce. If this week’s breakout has legs to stand on, there should be bids appearing, as Friday’s low of $2,453 essentially amounts to a breakout retest.
Non-commercials have slightly cut back their net longs the last two weeks but continue to have a sizable exposure.
Nasdaq (mini): Currently net long 2.4k, up 3k.
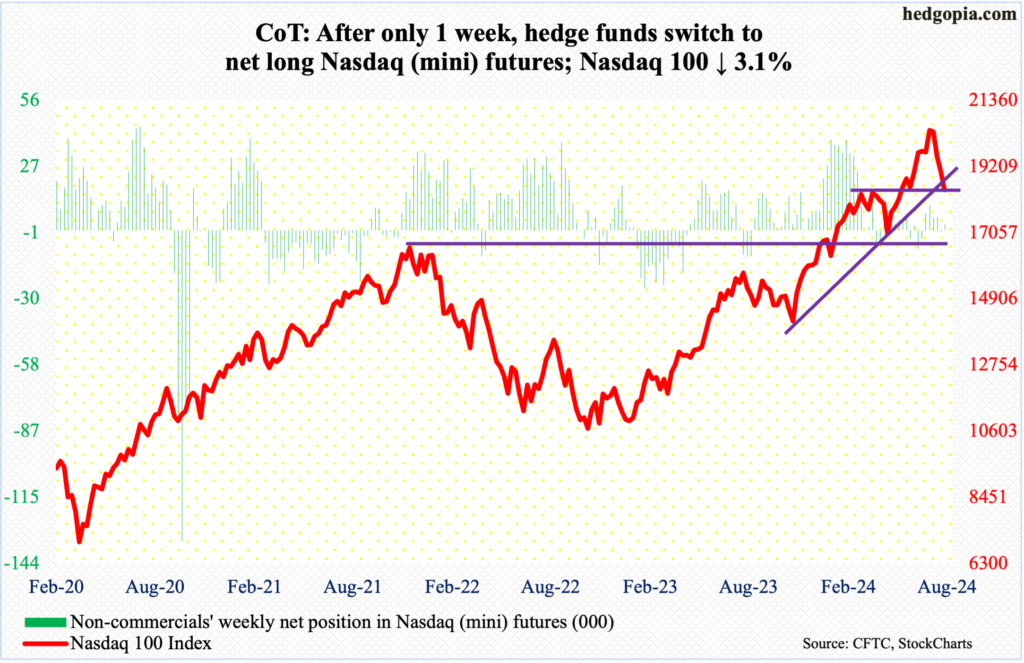
This week, June-quarter results from Microsoft (MSFT) and Amazon (AMZN) disappointed, while those from Apple (AAPL) and Facebook owner Meta (META) were received relatively well. Shockingly, Intel (INTC) crashed 26.1 percent post-results and now boasts $91 billion in market cap; in 2000, the company was worth $503 billion and $273 billion as recently as 2020. How fortunes change! Memo to today’s go-to names such as Nvidia (NVDA).
Last week, both Google owner Alphabet (GOOG) and Tesla (TSLA) disappointed with their results. In the aggregate, tech has failed to impress in this earnings season. Ahead of this, the Nasdaq 100 peaked as early as July 10th when it tagged 20691. From that high through Friday’s intraday low of 18264, it is down 11.7 percent.
Most probably, more pain lies ahead. Near-term, relief is possible for the bulls if they are able to defend horizontal support at 18300s. Friday was a spinning top session, and that support held, with the index closing at 18441.
Russell 2000 mini-index: Currently net short 34k, down 23.1k.
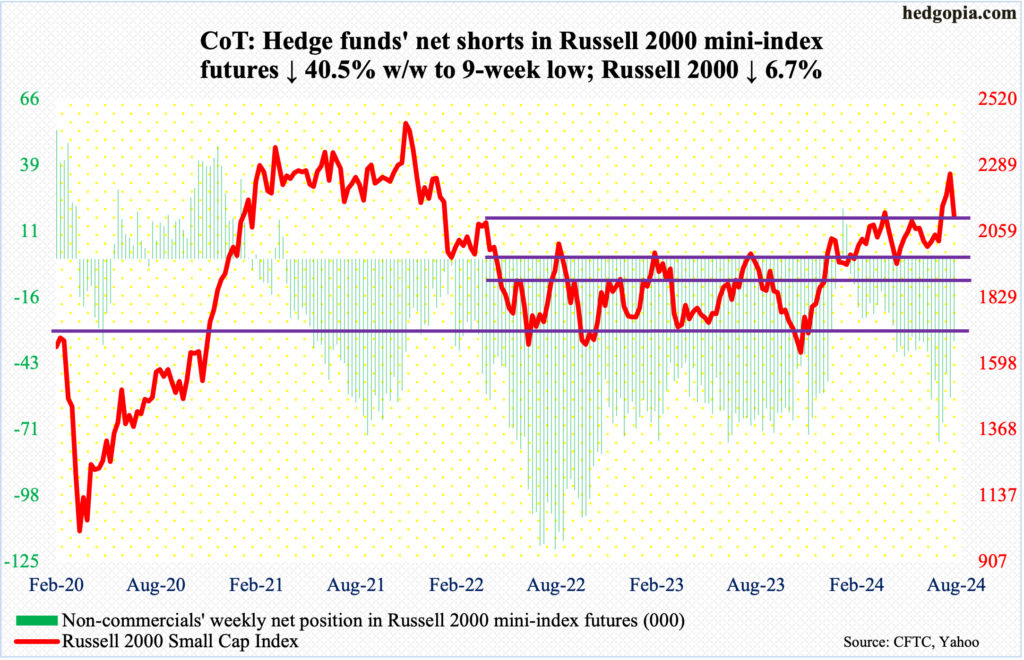
Leading up to this week, the Russell 2000 went sideways at 2260s for nine sessions. On Wednesday this week, it broke out, tagging 2300 intraday, but only to then come crashing back down. By the end of the week, the small cap index was down 6.7 percent to 2109.
Previously, the index has had trouble at 2100 going back to early March. Plus, 2144 represents a 61.8-percent Fibonacci retracement of the drop between the November 2021 peak (2459) and the June 2022 trough (1641); 2100 also represents a measured-move price target post-breakout at 1900 last December, as the index was trapped between 1700 and 1900 going back to January 2022.
The nine-session sideways action follows a sharp rally, surging 250 points over six sessions. On the 10th (this month), the index closed at 2052 and broke out of 2100 in the next session. This is an opportunity for small-cap bulls to prove that the recent surge in the Russell 2000 has staying power.
US Dollar Index: Currently net long 17k, down 1.3k.
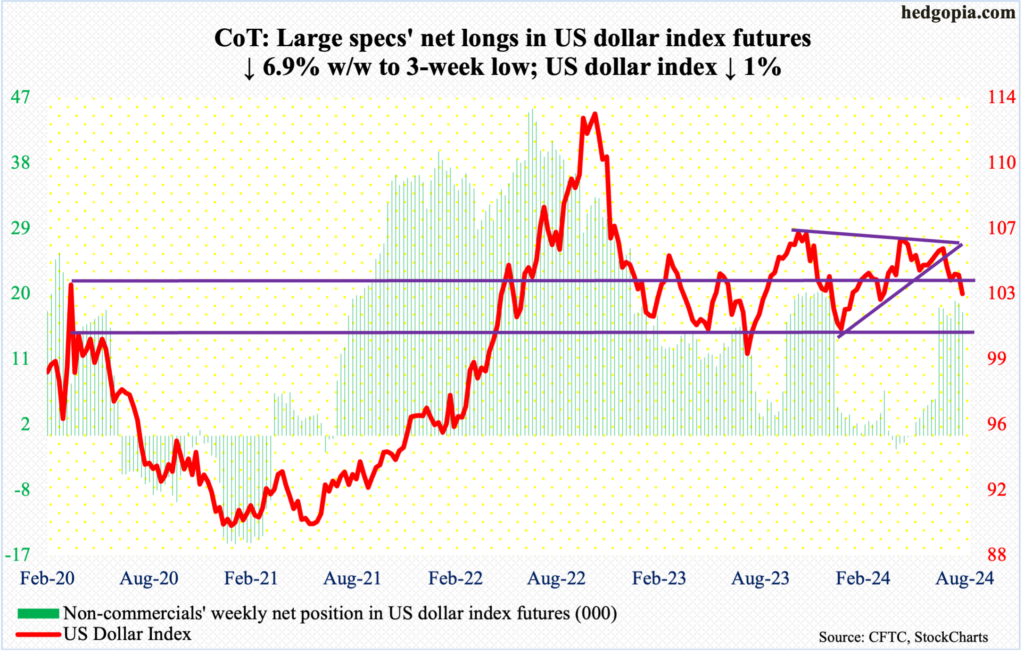
The US dollar index tumbled 1.2 percent on Friday to decisively lose the 200-day. For the week, it dropped one percent to 102.99.
The index’s problem began five or six weeks ago when dollar bulls were denied at a falling trendline from last October when it peaked at 107.05. Four weeks ago, it fell out of a symmetrical triangle, made up also of a rising trendline from last December when the index bottomed at 100.32.
Horizontal support at 103-104 goes back to December 2016, and this has now been breached. There is horizontal support at 102.30s, which also approximates trendline support from July last year at 102.
VIX: Currently net short 49.7k, down 8.4k.
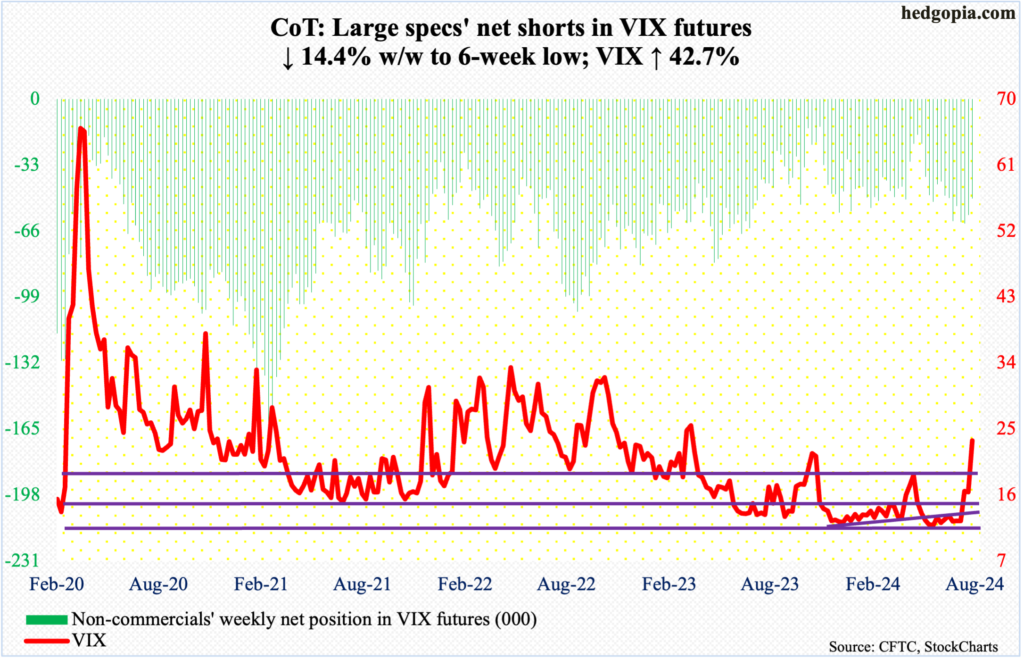
VIX had an amazing week, rising as high as 29.66 on Friday. This was the highest print since March last year. Volatility bulls, however, were unable to hang on to it, closing the session/week at 23.39, leaving behind a long upper wick.
It is too soon to say if Friday’s candle qualifies for a spike reversal, but it can very well turn out that way in the sessions to come. Medium- to long-term, VIX probably is not done going higher, but right here and now it probably needs a rest.
If the volatility index comes under pressure near-term but remains above 19, volatility bulls should consider this as victory.
Thanks for reading!
More By This Author:
Nasdaq 100-Russell 2000 Ratio Approaching Crucial Retest; Small-Cap Bulls Should Hope For Breach
Fortune-Telling With Futures - What Positions Noncommercials, Hedge Funds Are Taking
Russell 2000’s 250-Point Jump Over 6 Sessions Met With Selling At Potentially Important Technical Level


Comments
Log in or sign up to join the conversation.