
The Nasdaq 100 is down three weeks in a row, even as the Russell 2000 is up three weeks in a row. Amidst this, the ratio between the two is approaching a crucial retest. A failed retest will mean the ongoing rotation from tech into small-caps is here to stay, regardless if 2025 earnings estimates fall short.
(Click on image to enlarge)
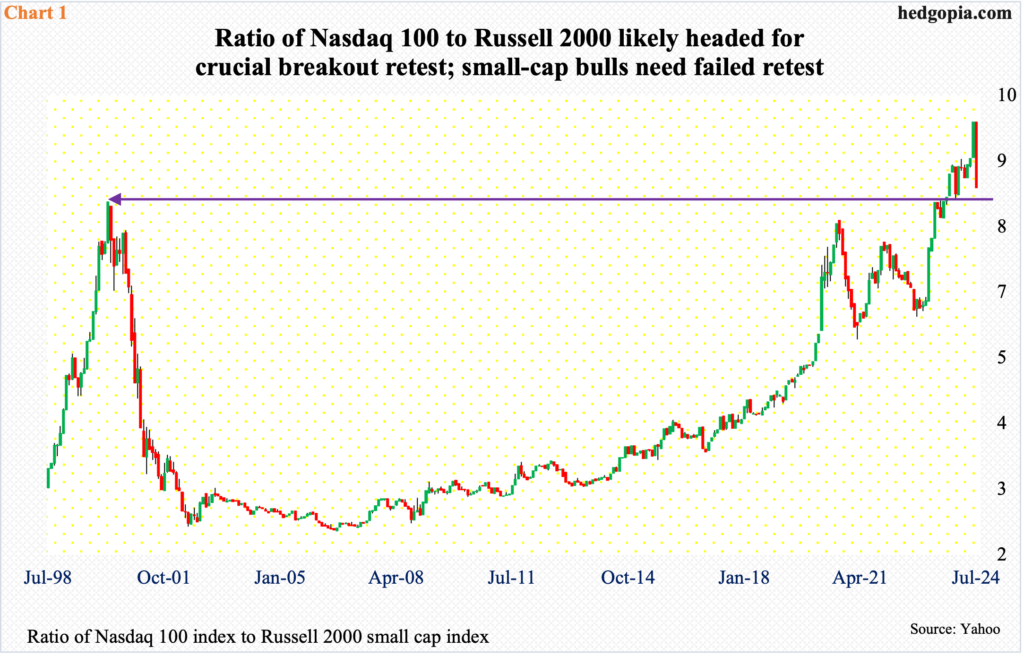
Small-caps are headed for a crucial retest vis a vis their relationship with tech.
For a couple of years leading up to the tech/telecom bubble peak in March 2000, the ratio of Nasdaq 100 to Russell 2000 went parabolic before the air came out and tech crashed. The ratio then bottomed in July 2006, and it was not until September last year that the 2000 high was eclipsed.
Both the Nasdaq 100 and the Russell 2000 peaked in November 2021. They both reached important lows in October 2022 and again in October 2023. Tech was galloping ahead, while small-caps were only trudging higher. The Nasdaq 100 surpassed its 2021 high last December, even as the Russell 2000 remains underneath.
Fast forward to now, the ratio hit a new high last month and, with three sessions to go, is down substantially this month (Chart 1). A retest looks imminent. A breach – probable – will mean the Russell 2000 will continue to outperform tech at least on a relative basis.
(Click on image to enlarge)
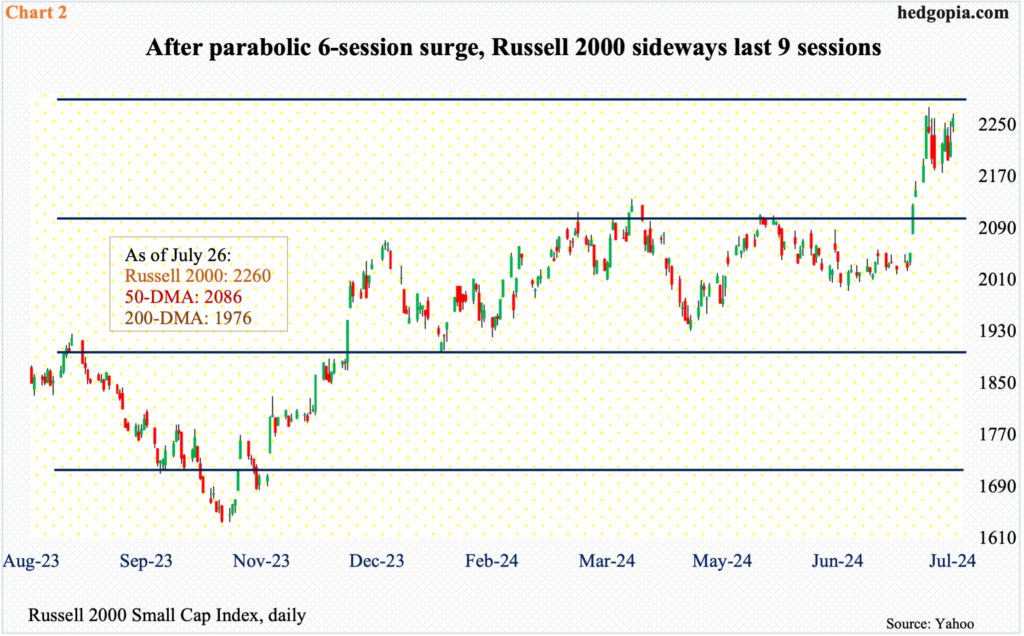
Long a laggard versus tech, the Russell 2000 came to life on the 11th this month. That was the day June’s CPI (consumer price index) came out and the report was cheered by investors, as it confirmed the prevailing disinflation trend. The Russell 2000 closed the 10th at 2052, breaking out of crucial 2100 in the next session post-CPI; five sessions later, the small cap index tagged 2278, which was the highest since January 2022. While these massive gains give out vibes of ‘too fast, too soon’, the index is attempting to digest the move in a sideways pattern.
In the last nine sessions, the Russell 2000 has hit 2260s or higher five times (Chart 2). A breakout here will lend credence to small-cap bulls’ assertion that the latest rally has legs to stand on. Even if the index retreats here, they will have another opportunity to put their foot down at 2100, which has proven to be an important level for bulls and bears alike.
After the Russell 2000 peaked in November 2021 at 2459, it subsequently troughed at 1641 in June 2022, which was then successfully tested in October of both 2022 and 2023. A 61.8-percent Fibonacci retracement of that drop lies at 2144; 2100 also represents a measured-move price target post-breakout at 1900 last December. Before that, the index went back and forth between 1700 and 1900 going back to January 2022. Plus, post-November 2021 peak, 2100 was lost in January 2022, followed by several unsuccessful attempts to enduringly reclaim the level, including a few attempts going back to early March this year.
(Click on image to enlarge)
June’s CPI meaningfully raised market bets on interest-rate cuts by the Federal Reserve, which has held the fed funds rate steady at a range of 525 basis points to 550 basis points since last July. They began tightening in March 2022 when the benchmark rates were languishing between zero and 25 basis points.
The Federal Open Market Committee meets this week, and no action is expected, but the policy-setting body will probably use this meeting as a setup for a cut in September. As things stand, futures traders expect three 25-basis-point cuts this year – one each in September, November and December. By September next year, they expect four more, ending that month at 375 basis points to 400 basis points.
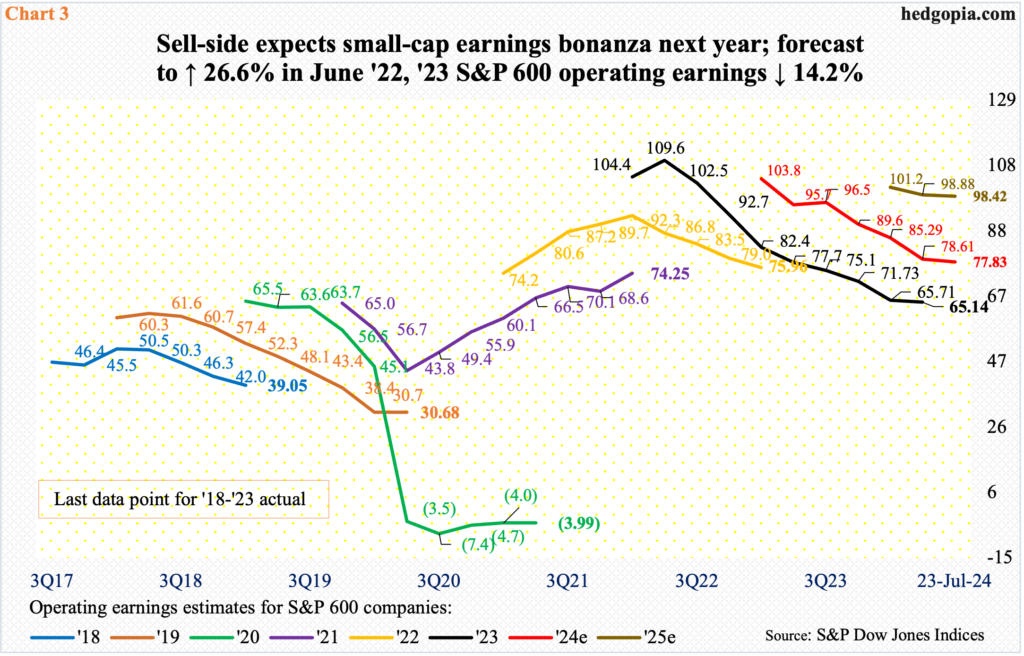
The sell-side is beginning to model this in. In the week to July 2nd, next year’s operating earnings estimates for S&P 600 companies were $98.48. Three weeks later – as of the 23rd – this stood at $98.42. These analysts are hoping for things to stabilize. Otherwise, 2025 estimates peaked at $102.88 early May and have been under pressure since. This year’s, however, continue lower, with $77.83 as of last Tuesday the lowest since estimates began in March last year when they were $105.68 (Chart 3).
At the current level of optimism, earnings are expected to shoot up 26.5 percent next year; this would have accelerated from this year’s expected growth of 19.5 percent. These estimates are just that – estimates. In June 2022, last year’s earnings were expected to surge 26.6 percent; when it was all said and done, 2023 earnings dropped 14.2 percent to $65.14.
One primary reason the Russell 2000 surged this month is the expectation that lower interest rates are supposed to relieve leveraged small-cap companies of balance sheet pressure. This in and of itself does not mean this will meaningfully flow through to the income statement, which is what the sell-side is beginning to price in, hoping for aggressive rate cuts by the Fed. If the central bank does indeed enter an aggressive rate-cutting cycle, then this will only happen if the economy massively slows down/enters recession. In this scenario, the balance sheet will get a lift, but the income statement will take a hit, as earnings tumble.
With that said, even in this scenario, it is possible the Russell 2000 continues to outperform the Nasdaq 100 on a relative basis – by dropping less than its large-cap tech peers. For that, the upcoming retest in Chart 1 needs to fail, opening the door for the ratio to continue lower.
More By This Author:
Fortune-Telling With Futures - What Positions Noncommercials, Hedge Funds Are TakingRussell 2000’s 250-Point Jump Over 6 Sessions Met With Selling At Potentially Important Technical Level
Latest Reading Of CoT Report: Futures Positions Of Noncommercials


Comments
Log in or sign up to join the conversation.