
Following futures positions of non-commercials are as of July 23, 2024.
10-year note: Currently net short 641.9k, up 4.4k.
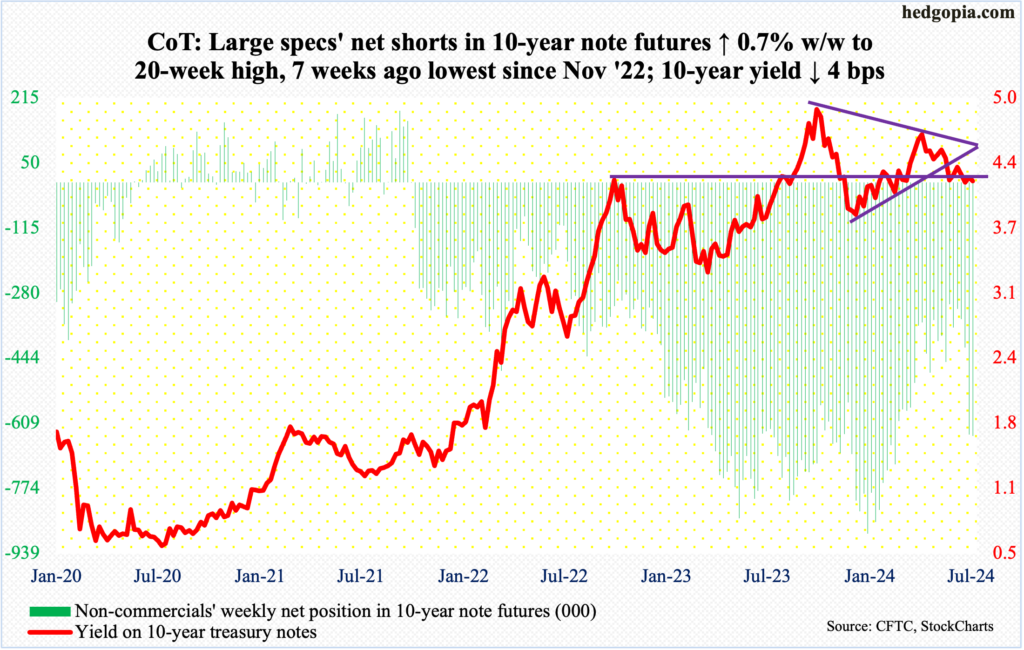
The FOMC meets next week. This will be the fifth meeting this year, and three more remain. It is certain the fed funds rate will remain at a range of 525 basis points to 550 basis points. Rates have been there since last July and were raised from zero to 25 basis points beginning March 2022.
In the futures market, traders are placing bets with 94 percent probability that the benchmark rates will be left unchanged next week. Amidst this, there have been calls for the policy-setting body to begin easing as soon as next week’s meeting. Bill Dudley, former New York Fed president, made such a call on Wednesday.
At the same time, a September (17-18) cut looks probable. The FOMC likely uses next week’s meeting as a set-up for that. Futures traders currently expect three 25-basis-point cuts this year – one each in September, November (6-7) and December (17-18). More surprising is the fact that they expect four more cuts next year, ending September 2025 at 350 basis points to 375 basis points. Yes, the economy is in deceleration, but this looks aggressive. Chair Jerome Powell likely pushes back against this market expectation.
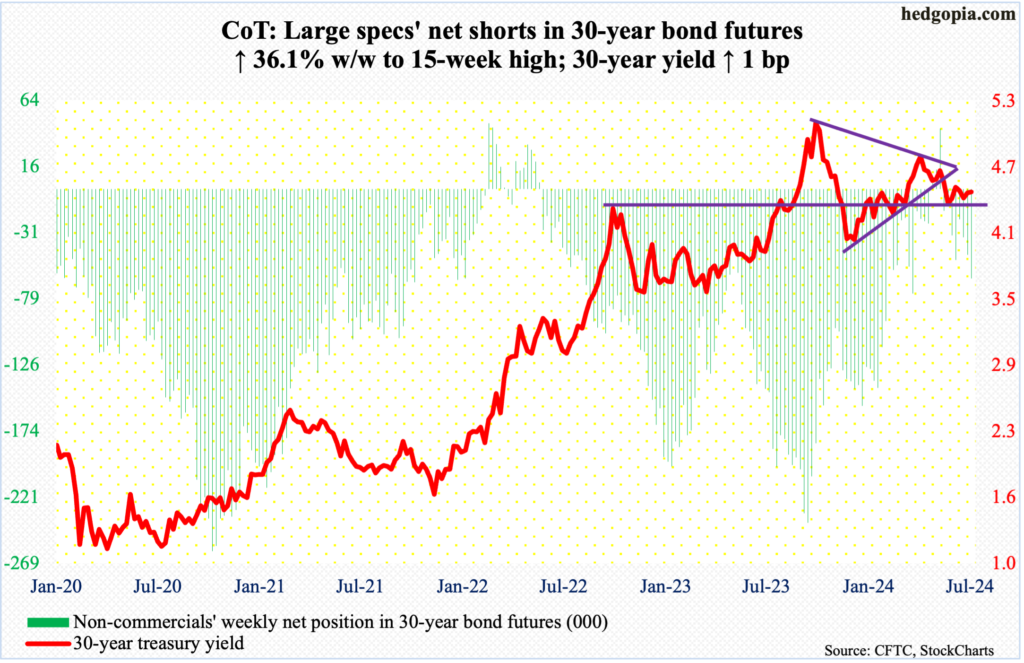
30-year bond: Currently net short 64.2k, up 17k.
Major US economic releases for next week are as follows.
The S&P Case-Shiller home price index (May) and job openings (JOLTs, June) are on deck for Tuesday.
In April, national home prices increased 6.3 percent year-over-year. Prices have risen with a six handle from January through April. Earlier, they were rising at a record 20.8 percent in March 2022, before weakening to post three consecutive months of negative growth from April to June last year.
Non-farm job openings rose 221,000 month-over-month in May to 8.14 million – a two-month high. April’s 7.92 million was the lowest since February 2021, with the all-time high of 12.18 million recorded in March 2022.
Wednesday brings the employment cost index (2Q24). Private-industry total comp increased 4.1 percent y/y in the March quarter. The 5.5-percent growth registered in 2Q22 was a 38-year high.
Labor productivity (2Q24) and the ISM manufacturing index (July) will be reported on Thursday.
In the March quarter, non-farm output/hour increased 2.9 percent from a year ago. This was the fastest pace in 12 quarters.
Manufacturing activity in June fell two-tenths of a percentage point m/m to 48.5 percent – a four-month low, contracting for the third straight month after March’s 50.3 percent reading. March’s expansion broke a 16-month streak of contraction before contracting again.
Payrolls (July) and durable goods orders (June, revised) are out Friday.
In the first six months this year, the economy created an average 222,000 nonfarm jobs per month. This is decent but slower than the monthly average of 251,000 in 2023, 377,000 in 2022 and 604,000 in 2021.
Orders for non-defense capital goods ex-aircraft – proxy for business capex plans – rose 0.95 percent m/m in June to a seasonally adjusted annual rate of $73.994 billion, edging past the prior high of $73.992 billion posted last December.
WTI crude oil: Currently net long 286.7k, down 30.2k.
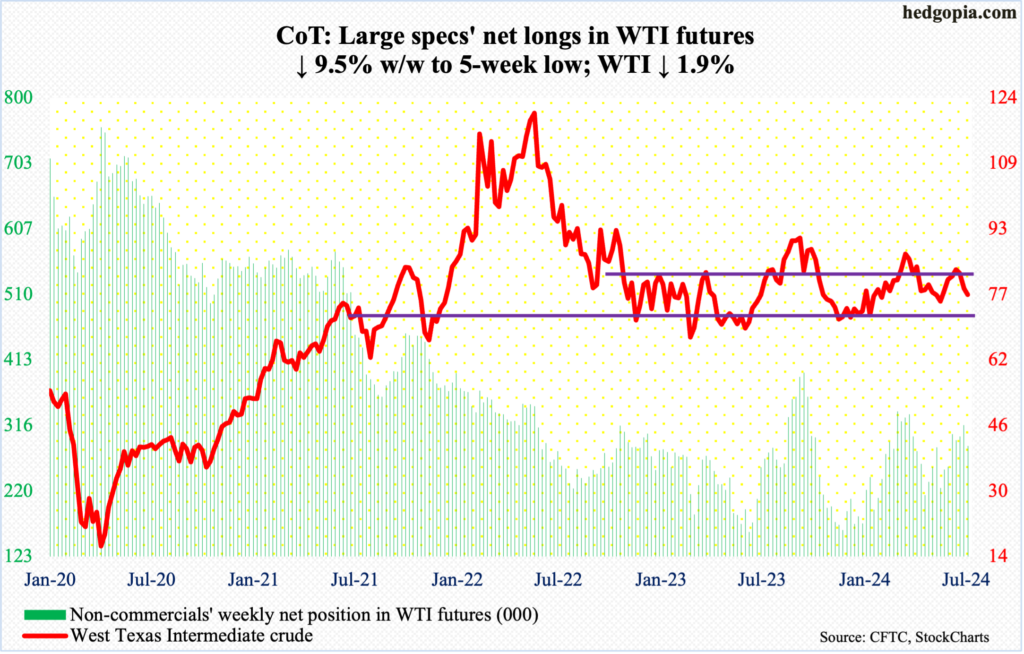
Following last Friday’s breach of the 50- and 200-day, West Texas Intermediate crude found resistance at the latter average ($78.64) throughout this week. In the end, it fell 1.9 percent for the week to $77.16/barrel. This was the third consecutive weekly drop after peaking at $84.52 on July 5th when a falling trendline from last September’s high ($95.03) drew sellers. A rising trendline from the May 2023 low ($63.57) extends to $74, which may just act like a magnet for now.
This Thursday, WTI fell as low as $76.04, followed by Friday’s $76.19, before drawing bids.
In the meantime, US crude production in the week to July 19th was unchanged at record 13.3 million barrels per day for the third week in a row; the level was previously hit seven times from last December to February. Crude imports dropped 166,000 b/d to 6.9 mb/d. As did stocks of crude, gasoline, and distillates, which respectively declined 3.7 million barrels, 5.6 million barrels and 2.8 million barrels to 436.5 million barrels, 227.4 million barrels and 125.3 million barrels. Refinery utilization decreased 2.1 percentage points to 91.6 percent.
E-mini S&P 500: Currently net short 13.2k, down 52.2k.
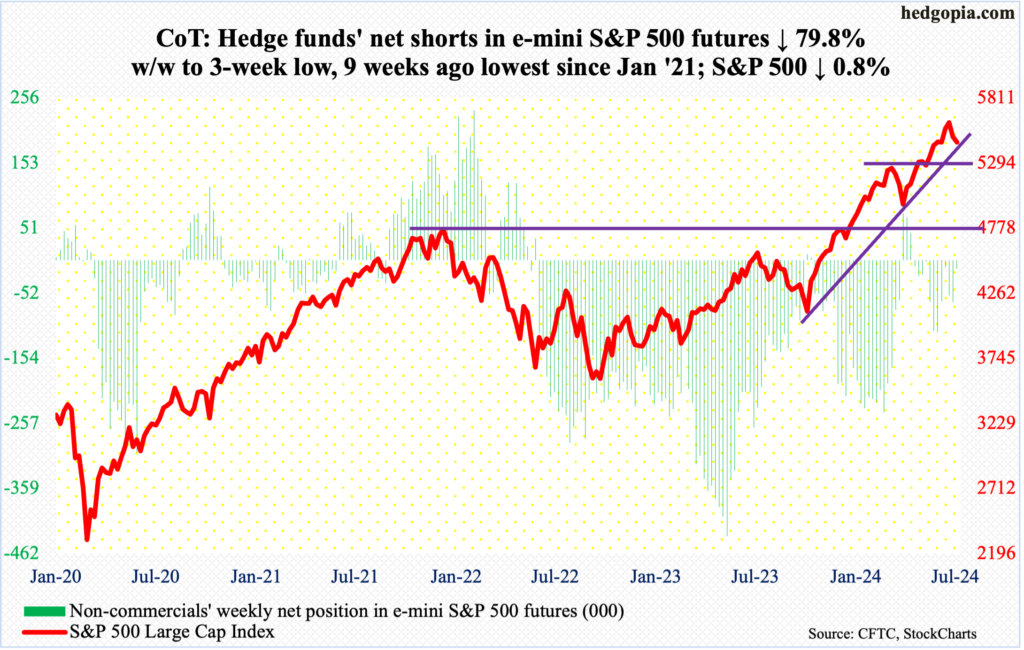
After losing two percent last week, the S&P 500 was down another 2.1 percent this week through Thursday’s intraday low of 5391. That low also tested a rising trendline from last October’s low, and it was defended. Friday’s 1.1-percent rally helped the large cap index finish the week down only 0.8 percent to 5459.
Bulls at the same time faced resistance at 5490s both Thursday and Friday. The index can continue higher near-term, and for that, cooperation is needed from both the Fed and Big Tech earnings.
Wednesday’s gap-down gets filled at 5550s. Incidentally, Thursday’s low just about filled the June 12th gap-up at 5370s.
Euro: Currently net long 35.9k, up 11.2k.
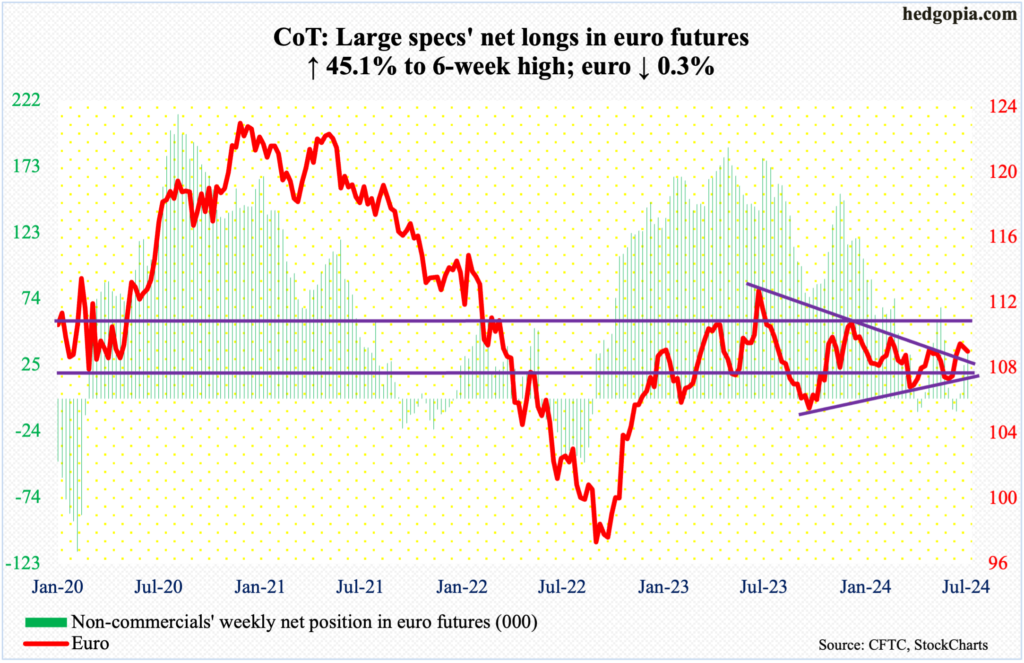
Last week, after rallying for three weeks, the euro formed a weekly gravestone doji right on trendline resistance from last July when it topped at $1.128. This week, it gave back 0.3 percent to $1.086, with bids showing up just above the 50- and 200-day (respectively $1.081 and $1.082). A breach of these averages opens the door toward trendline support from last October when the currency bottomed at $1.045; this support lies at $1.07.
Gold: Currently net long 273.1k, down 12k.
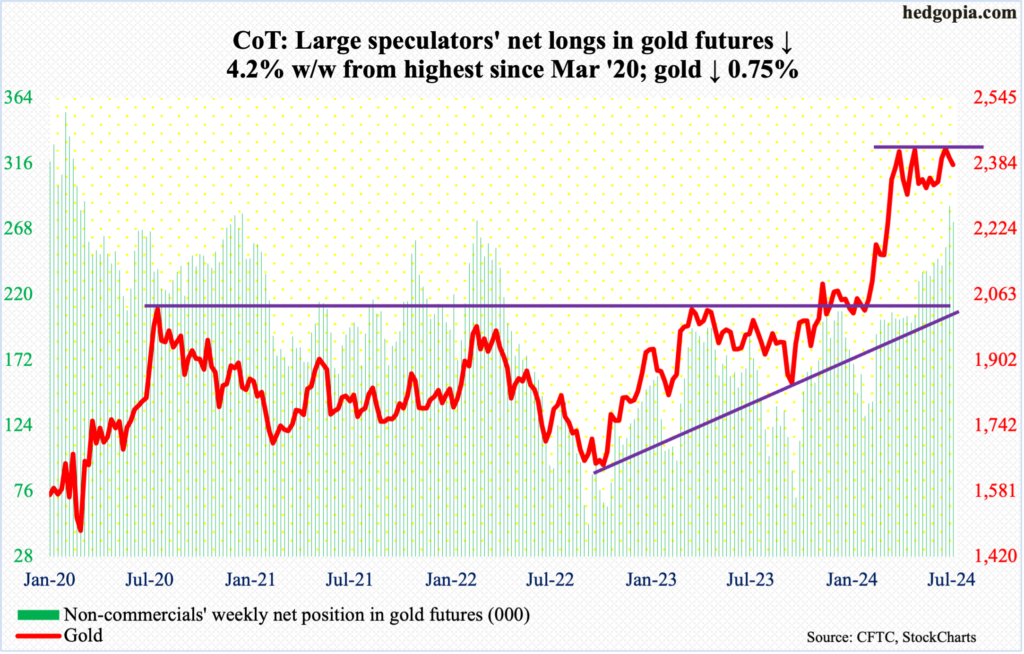
Gold suffered its second negative week, down 0.75 percent this week to $2,381/ounce. Last week, it peaked at $2,488 on the 17th. Gold bugs, however, were unable to hang on to those gains; if they did, this would have been an important breakout.
Gold went sideways for three months before posting a new high followed by a reversal last week. On April 12th, it hit a new intraday high of $2,449 before selling off a tad. This was eclipsed on May 20th, as the yellow metal ticked $2,454 before once again coming under pressure. All along, bids showed up at $2,300, a breach of which will have shifted momentum to the bears.
Non-commercials are worth watching here. Last week (in the week to 16th), they were the most net long since March 2020. This week, they cut their holdings a tad. A break of $2,300 in the cash can lead these traders to begin to reduce their exposure.
Nasdaq (mini): Currently net short 613, up 6.3k.
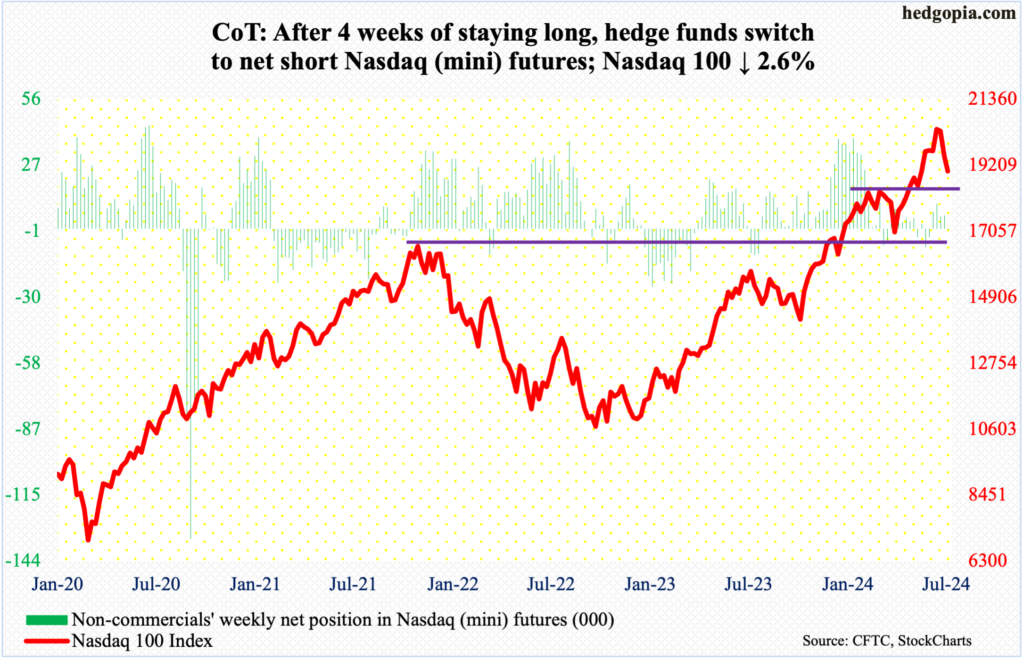
This week, both Google owner Alphabet (GOOG) and Tesla (TSLA) disappointed with their June-quarter results. Next week is heavier, with Microsoft (MSFT) on schedule for Tuesday, Facebook owner Meta (META) for Wednesday, and Apple (AAPL) and Amazon (AMZN) for Thursday. Nvidia (NVDA), which is on a July quarter, does not report until August 28th.
Tech began selling off heading into the earnings season. The Nasdaq 100 reached a new all-time high of 20691 on July 10th and headed lower in the next session. This week, it declined 2.6 percent to 19024 – its third consecutive weekly drop.
On Thursday, selling stopped at 18722. There is decent support at 18400s. If the tech-heavy index reacts adversely to next week’s earnings, this support likely holds – for now. The 50-day was lost on Wednesday, and tech bulls will try their best to recapture the average as soon as possible.
Russell 2000 mini-index: Currently net short 57.1k, up 9.7k.
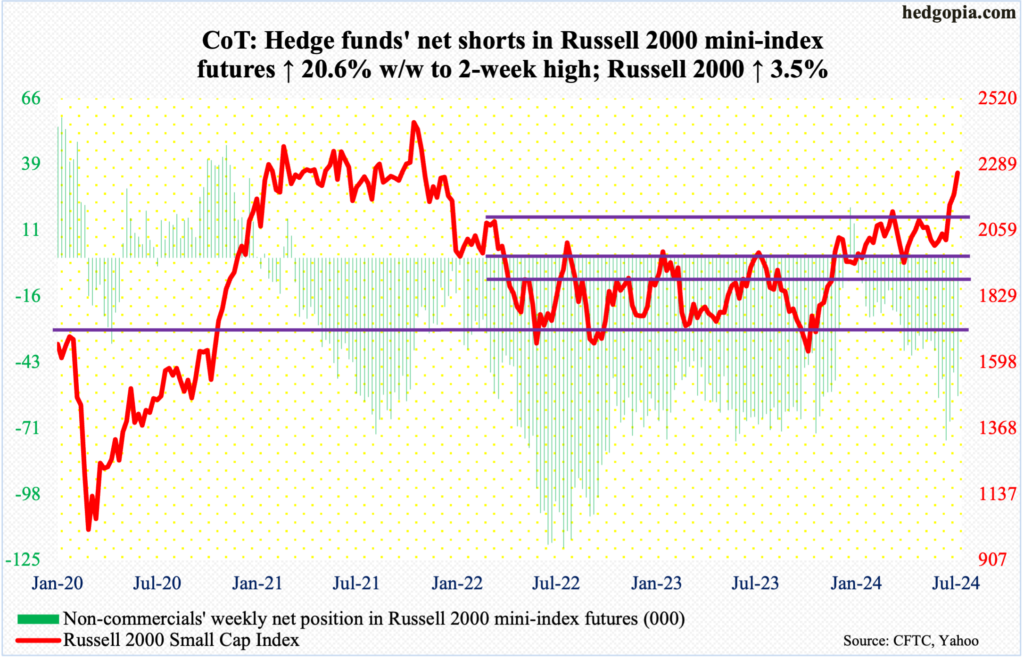
Rotation lives on. As opposed to the Nasdaq 100 which is down three weeks in a row, the Russell 2000 is up the same number of weeks, with this week up 3.5 percent to 2260.
In the last nine sessions, the Russell 2000 has hit 2260s or higher five times, with July 17th registering 2278, which was the highest since January 2022. The small cap index peaked in November 2021 at 2459 and remains well under that record.
The nine-session sideways action follows a sharp rally, surging 250 points over six sessions. On the 10th (this month), the index closed at 2052 and broke out of 2100 in the next session. This level is important. The index has had trouble at 2100 going back to early March. Plus, 2144 represents a 61.8-percent Fibonacci retracement of the drop between the November 2021 peak and the June 2022 trough (1641); 2100 also represents a measured-move price target post-breakout at 1900 last December, as the index was trapped between 1700 and 1900 going back to January 2022.
A breakout here will mean 2100 retest will have to wait a while.
US Dollar Index: Currently net long 18.2k, down 330.
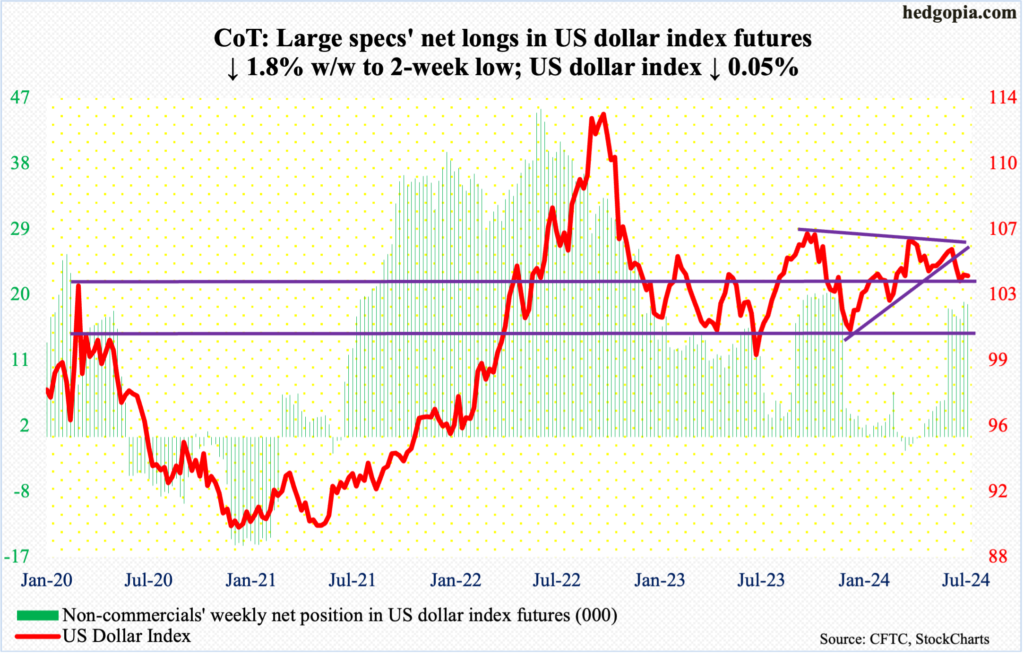
Horizontal support at 103-104 goes back to December 2016, and dollar bulls and bears are fighting for control. This week, the US dollar index closed at 104.06, and last week at 104.11.
Earlier, three weeks ago, the US dollar index fell out of a symmetrical triangle, made up of a falling trendline from last October when it peaked at 107.05 and a rising trendline from last December when the index bottomed at 100.32. But the bears have thus far failed to make much out of this breakdown. Hence the significance of 103-104.
VIX: Currently net short 58k, down 4.3k.
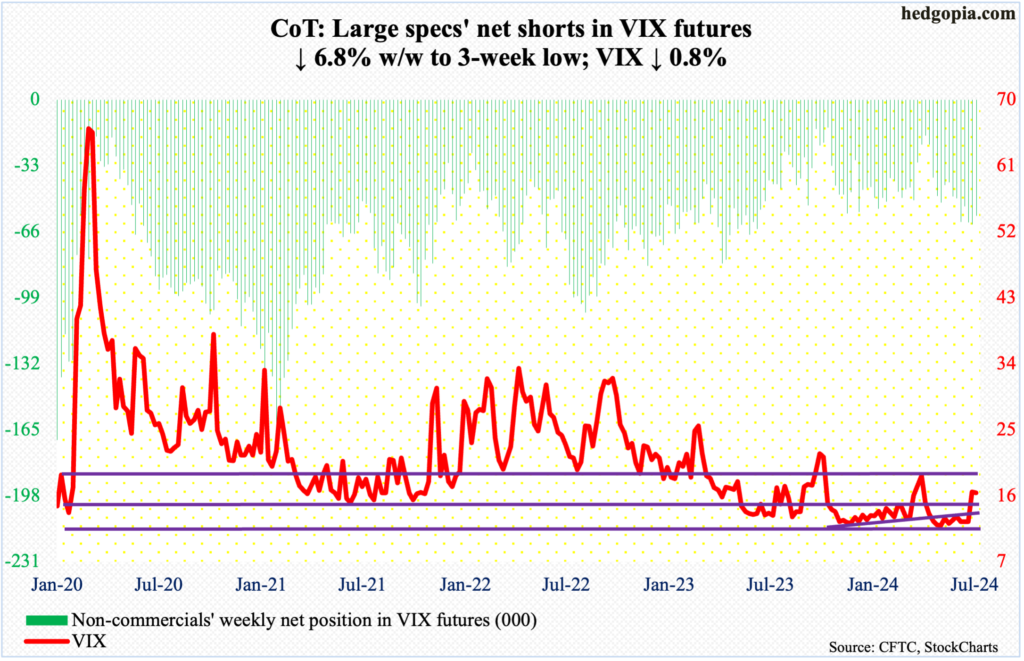
On Thursday, VIX ranged from a high of 19.36 and a low of 16.42, closing at 18.46. The volatility index ticked 10.62 intraday only four sessions before that. It is too soon to say if Thursday’s action qualifies for a spike reversal. In the past, spike reversals after sharp rallies translate to a quick reduction in volatility.
That said, Friday’s 2.07-point decline after Thursday’s wild session suggests VIX (16.39) may very well want to go lower in the near-term. The 200-day lies at 14.22.
Thanks for reading!
More By This Author:
Russell 2000’s 250-Point Jump Over 6 Sessions Met With Selling At Potentially Important Technical LevelLatest Reading Of CoT Report: Futures Positions Of Noncommercials
Amidst Frothy Sentiment, Tech Leads Equities Lower


Comments
Log in or sign up to join the conversation.