Some Forecasts Of Industrial Production Growth

Image source: Pixabay
Forecasts of recession vary with indicators (term spread, foreign term spreads, debt-service ratios). Forecasts of economic activity — as measured by industrial produciton — also differ by predictor.
I compare the forecasts from the 10yr-3mo spread, the foreign term spread (Ahmed/Chinn), and stock market factor identified by Chatelais/Stalla-Bourdillon/Chinn (my thanks to Arthur Stalla-Bourdillon for updating the stock market factor).
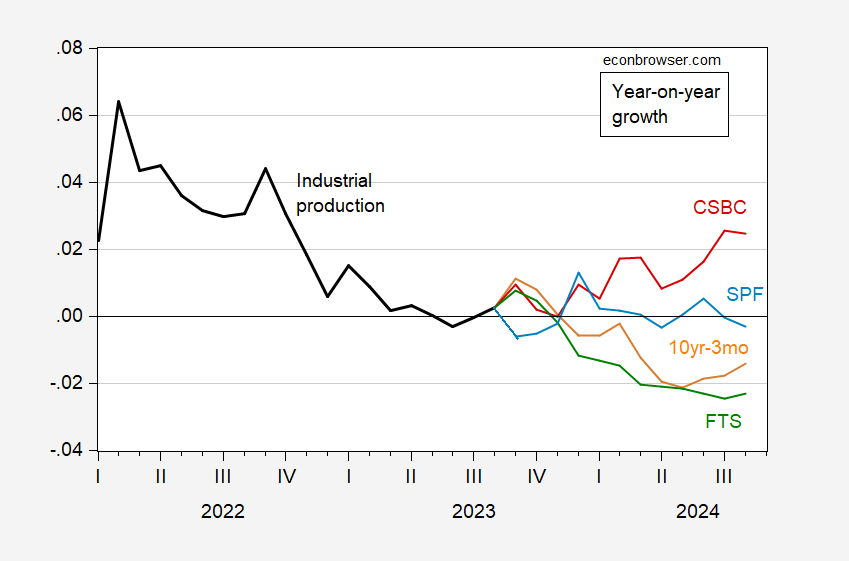
Figure 1: Year-on-year growth of industrial production (black), 1 year-ahead prediction from 10yr-3mo term spread (orange), from foreign 10yr-3mo term spread (green), from Chatelais/Stalla-Bourdillon/Chinn stock market factor (red), and from Survey of Professional Forecasters August forecast (light blue). Foreign term spread is GDP-weighted long term interest rate minus short term policy rate. SPF industrial production quadratic interpolation to monthly. Forecasts based on three year sample ending 2023M08 (not from rolling window). Source: Federal Reserve, Treasury via FRED, Stalla-Bourdillon calculations, Philadelphia Fed, Dallas Fed DGEI, and author’s calculations.
Caveat: I use the Dallas Fed DGEI spread instead of the Ahmed-Chinn version. The former is GDP weighted for all advanced countries, whereas the latter uses Canada, Euro area, UK, and Japan only. The two move pretty similarly. The adj-R2 of regressing the Ahmed-Chinn measure on the one used here is 0.8 (in levels, 0.45 in first differences).
The term spread (domestic, foreign) both present a pessimistic outlook. These indicators also paint a picture of imminent recession. The stock market factor that incorporates information about leading sectors (like housing related) predicts resumed growth.
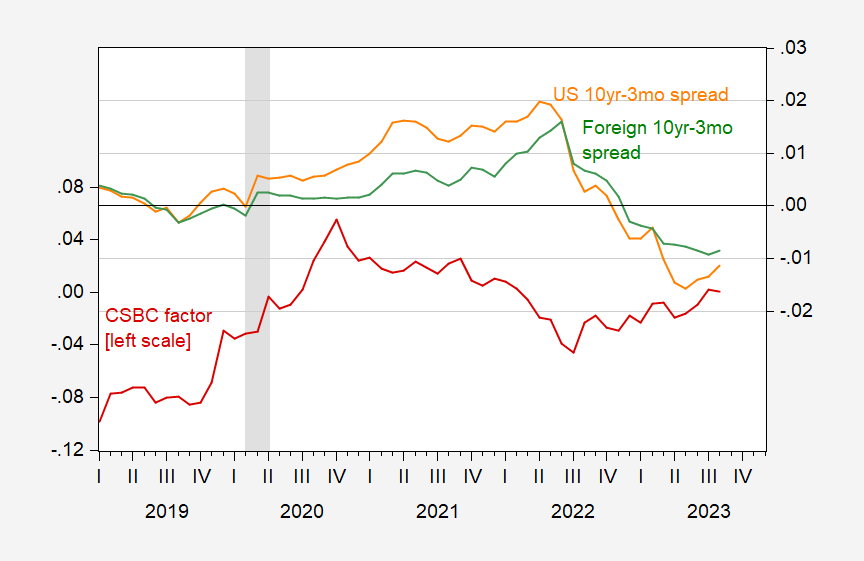
Figure 2: 10yr-3mo term spread (orange), foreign 10yr-3mo term spread (green), Chatelais/Stalla-Bourdillon/Chinn stock market factor (red). Foreign term spread is GDP-weighted long term interest rate minus short term policy rate. Source: Treasury via FRED, Stalla-Bourdillon calculations, Dallas Fed DGEI, and author’s calculations.
Important point in thinking about these results versus those for recessions. Recessions are analyzed using a binary variable conforming to the NBER chronology. Industrial production growth is a continuous variable, and is only one of several key variables followed by NBER’s Business Cycle Dating Committee (nonfarm payroll employment and personal income ex-transfers rank higher).
More By This Author:
Almost Half A Century Of The Economic Policy Uncertainty IndexThe Debt-Service Ratio And Estimated Recession Probability
FT-Booth September Survey


