
Tuesday Talk: Where Is Santa?
Monday continued the downtrend for the major indices on Wall Street which concluded a second week of losses on Friday. As for an annual Santa rally, that seems nowhere to be found.

Yesterday the S&P 500 closed at 3,818, down 35 points, the Dow closed at 32,758, down 163 points and the Nasdaq Composite closed at 10,546, down 159 points.
Most actives were all in the red with Monday being particularly rough for Warner Bros-Discovery (WBD) and AT &T (T), down -5.8% and -3.4%, respectively.

Chart: The New York Times
In early morning trading S&P 500 market futures are down 3 points, Dow market futures are up 7 points, and Nasdaq 100 market futures are down 29 points.
TalkMarkets contributor Bob Lang says that traders and investors should stop Stop Second-Guessing The Fed.
"The Fed came out swinging last week and raised interest rates as expected. But somehow, investors and traders were shocked and dismayed. Frankly, I don’t understand why. Fed Chair Jerome Powell and the Open Market Committee have voiced their views for months in a consistent manner."

"When you decide to go against the Fed, you’re going to eventually lose. They have an unlimited timeline and a blank checkbook. Those are two extremely powerful and influential tools. With endless time and money, the Fed can influence behavior like no other institution. We’ve seen this play out on both sides of the market.
On the bullish side, the Fed aggressively purchased bonds and backed up other assets to prop up markets in 2020. This flooded the markets with liquidity and probably saved us from a depression. If you were bearish, your portfolio was run over by a freight train. If you were bullish, you had a great run higher – until this year...
On the bearish side, the Fed pulled liquidity from the markets to reduce its balance sheet and moved interest rates higher. That was a shock to the system this year, and it cast a pall over the stock market. So many people were in denial, repeating mantras of the past like “Don’t trust the Fed,” and “They will never have the courage to make such bold moves.” Seeing is believing though, as the current economy is careening off the rails towards a recession. If you have been bullish, stop second-guessing the Fed. It’s a losing battle, and your portfolio is the one that pays the price."
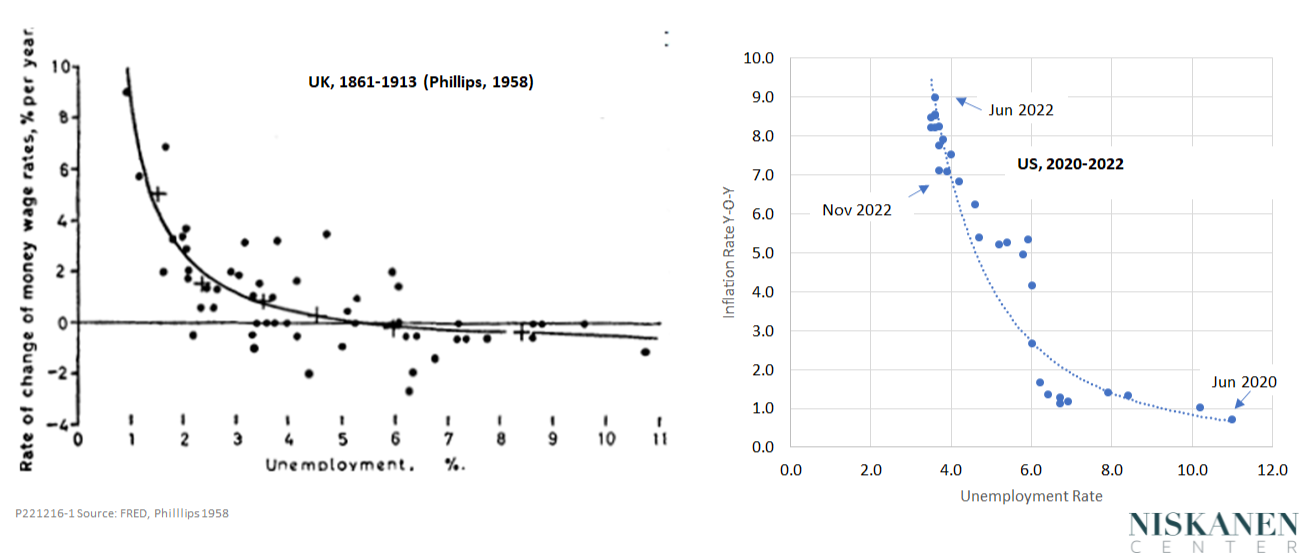
Contributor Ed Dolan takes a look at the data and finds, The Latest Phillips Curve Data Show No Return To Stagflation.
"The Phillips curve, you may recall, is a diagram showing an inverse relationship between inflation and unemployment. It first appeared in a famous 1958 article by its namesake, A. W. Phillips. His original chart, based on data for the UK from 1861 to 1913, is shown in the right-hand panel of Figure 1. The left-hand panel shows U.S. data from June 2020 to November 2022. What has happened here in the last two and a half years certainly looks like a Phillips curve."
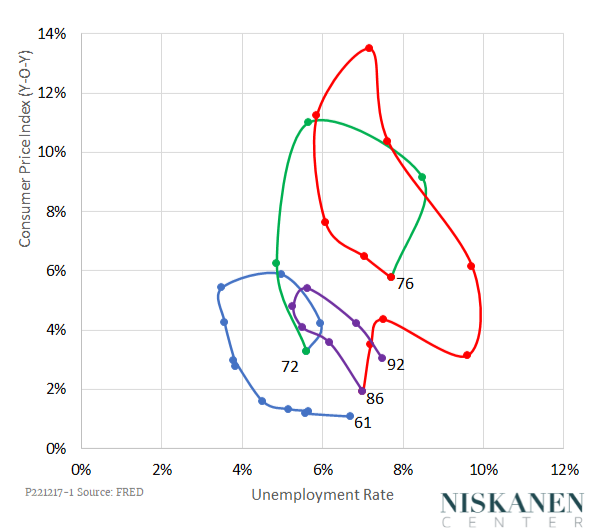
"The stagflation of the 1970s was, in a sense, a manifestation of the Phillips curve, but a Phillips curve gone mad, not an orderly one like those of Figure 1. Stagflation was a neologism coined as a name for a combination of high inflation and stagnating employment that can occur when the economy, having reached the peak of the Phillips curve, refuses to slide smoothly back the way it came. Instead of following the Phillips curve, unemployment continues to rise even as inflation continues to its peak and stays high even as inflation declines. As a result, a chart of inflation and unemployment over the 30 years from 1961 to 1992, as shown in Figure 2, is not a simple set of parallel Phillips curves but a series of clockwise loops."
Figure 2: “Stagflation:” 1961-1992
"To assess the chance that the current U.S. inflation will turn into stagflation, we need to know a little about the theory behind the movements of prices and employment. I explained that theory in detail in an earlier commentary on this site. To make the long version short, the time-path of the inflation and unemployment rates depends on how workers, consumers, and business leaders form their expectations of future inflation...
Under conditions of adaptive expectations, if the Federal Reserve raises interest rates to push back against inflation, the economy will enter stagflation. Output will fall and unemployment will rise, but prices, propelled by expectations of future inflation, will continue to increase. Eventually, if the Fed persists, it will win the battle. Inflation will begin to fall, but only at the cost of an uncomfortably deep recession in the real economy.
So, which is happening now? Have inflation expectations remained anchored, or have they become adaptive, dooming us to a bout of stagflation?
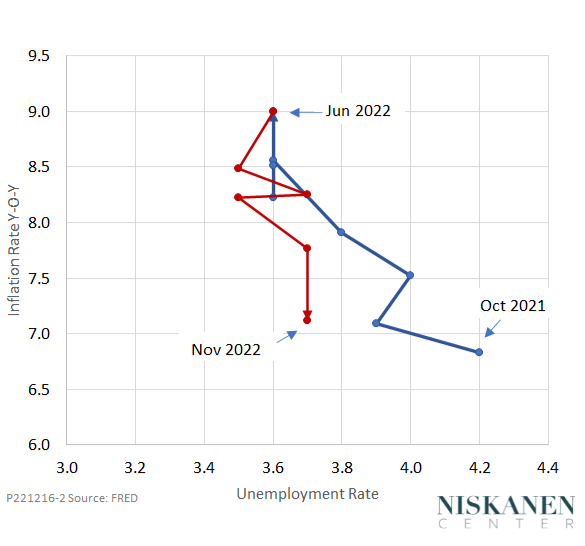
Fortunately, the data from recent months strongly suggest that inflation expectations remain anchored. Figure 3 shows a more detailed picture of what has happened to inflation and unemployment over the past year. From October 2021 to June 2022, unemployment fell as inflation rose, following a classic Phillips curve pattern. Since mid-year, inflation has come down in response to the Fed’s aggressive series of interest-rate hikes. As inflation has fallen, unemployment has increased, but only a bit. There is no sign of a clockwise stagflationary overshoot, as repeatedly happened from the 1960s through the 1980s."
Figure 3 – The Phillips Curve: June 2020-November 2022
"Of course, risks remain. A COVID “exit surge” in China could derail supply chains worldwide. An escalation of the Russia-Ukraine war could cause a spike in oil prices. The Fed might overdo it and keep pushing interest rates up further than they should, touching off a deep recession. But so far, so good."
For a further detailed explanation see the full article.
Expanding the "Recession, Yes or No?" discussion, TM contributor David Moenning says Place Your Bets.
"If there is anything I've learned in my 35+ years of managing money for a living it is that markets HATE uncertainty - especially when it comes to the macroeconomic outlook. And I think it is safe to say that the extreme uncertainty surrounding the outlooks for inflation, interest rates, the economy, and earnings that is responsible for this year's bear market environment."

"In short, the Fed's fight against inflation caused investors to worry about growth. Or in this case, the distinct possibility for a lack thereof from both the global economy and corporate earnings. As a result, stock prices, which tend to be a discounting mechanism for future expectations, moved lower...
The question at times like these is, how much is enough? As in, how much of a decline in stock prices is needed to sufficiently discount the outlook for the future?
Granted, the ultimate answer here lies in the eyes of the beholder. But sometimes it is a good idea to look back at history for clues. So, let's take a look at the analysis from Ned Davis Research Group of all bear markets since 1900.
Cutting to the chase, what NDR found was that the degree of damage caused by a given bear can be classified into two different categories: Those bears that were accompanied by a recession and those that weren't."
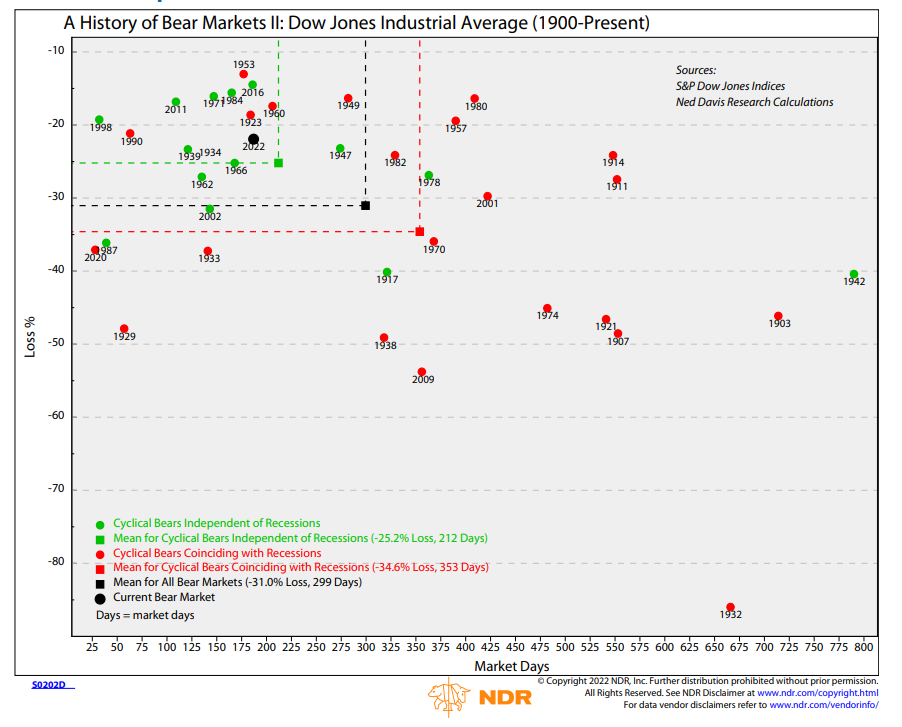
"As the chart indicates, the average decline for bear markets that are accompanied by a recession in the U.S., is -34.6%, or about 20% lower from current prices. This suggests that the market has not "discounted" the possibility of the economy entering a full-blown recession.
At the same time, we should note that the average bear market that is NOT accompanied by a recession has produced losses of -25.2%. So, again, using history as our guide, IF the economy can avoid a recession, it is easy to argue that the low seen in October (at -25.4%) could represent a sufficient degree of discounting...
So, IF the economy is going to experience a full-blown recession, then there is likely more pain to come...
From my seat, the question of recession becomes the most important issue of 2023. At least at this point in time, the answer is, well, uncertain. And this, dear readers, is the reason why stocks appear to be struggling mightily at the present time...
There are no shortage of indicators telling us a recession is coming including those inverted yield curves, a Regional Fed Indicator model, the Philly Fed State Diffusion Index, and the LEI readings. In sum, there can be little argument that these indicators - all of which have strong records - tell us a recession is on its way...
From my perch, the key to the game in the coming months boils down to timing. The inflation internals appear to be going in the right direction and it is primarily rents (which have a lagged effect on the inflation index) keeping CPI high. But this too shall pass (in time) as rents are now starting to fall.
So, the bottom line is that there is still a great deal of uncertainty about the future. And until that uncertainty can be resolved, the stock market is likely to remain volatile and susceptible to data/headlines."
It's worth taking a look at Moenning's full article, he includes several charts and indicators detailing yes or no recession sentiment.
Contributor Jill Mislinski has the latest World Markets Update, which shows Mumbai as the clear Y-t-D frontrunner.
"Seven of eight indexes on our world watch list posted losses through December 19, 2022. The top performer is India's BSE SENSEX with a YTD gain of 6.1%. London's FTSE 100 is in second with a loss of 0.31%, and Tokyo's Nikkei 225 is in third with a loss of 5.4%. Coming in last is our own S&P 500 with a loss of 19.9% YTD.
Here are all eight world indexes in 2022 and the associated table sorted by YTD."


See the article for additional historical and comparative world markets data.
Rounding out today's column with a year end review, TM contributor Rod Raynovitch finds his Healthcare Portfolio Is Doing Well But Biotech Stocks Are Mired In Macro.
"If you have been reading our reports over the past two years your stock portfolio should have beaten the market. Our top picks are United Health (UNH) up 4.29% YTD and 135.7% over 5 years, Merck (MRK) is up 42.46% YTD with good momentum lately, and our top large cap biopharma picks having all done well but lately have been hit with PE compression. But PEs remain at lower end in the mid-teens with dividends. Still near 52-week highs are GILD, LLY, MRK, and REGN and we still like ABBV and VRTX despite the recent volatility. BMY is the weakest among our holdings and is a bit overvalued with a PE of 24 and weak momentum lately. Here are some financial metrics as we approach Q4 and 2022 final large cap biopharma earnings in January.
One concern we have is that many strategists favor the healthcare sector in 2023. The reason given is the defensive nature of the sector with more predictable biopharma earnings and robust product pipelines. And with strong balance sheets large caps have the ability to do M&A to strengthen product portfolios.
The biotech sector has not done well in 2022 despite some strong runs. Small and mid-cap stocks are more “risk-off’ with interest rates rising and sentiment waning. The Russell 200 (IWM) is off 22% YTD but the biotech smaller cap XBI is down 27% with momentum waning. The technicals on the XBI in 2022 do not look good with three tries at the $95 level falling below $80 again today."

That's a wrap.
As for Santa, you might find him here.

More By This Author:
TalkMarkets Image Library
Thoughts For Thursday: Slower But Higher
Tuesday Talk: Cool Your Heels


