
The Latest Phillips Curve Data Show No Return To Stagflation
Since the summer of 2020, when the U.S. inflation rate began to rise, mentions of the Phillips curve have risen sharply. The term has featured in warnings that we are at risk of returning to the dread malady of “stagflation” that plagued the economy from the 1960s to the 1980s.
Are we really facing such a risk? The latest data say “No.”
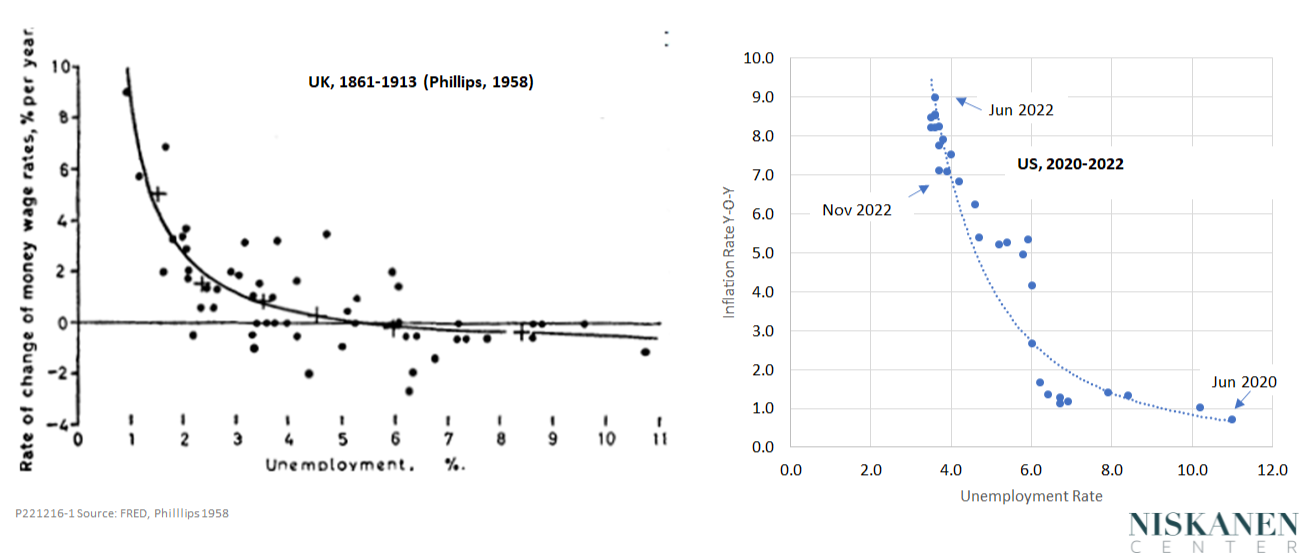
The Phillips curve, you may recall, is a diagram showing an inverse relationship between inflation and unemployment. It first appeared in a famous 1958 article by its namesake, A. W. Phillips. His original chart, based on data for the UK from 1861 to 1913, is shown in the right-hand panel of Figure 1. The left-hand panel shows U.S. data from June 2020 to November 2022. What has happened here in the last two and a half years certainly looks like a Phillips curve.
Figure 1 – The Phillips Curve, then and now
(Click on image to enlarge)
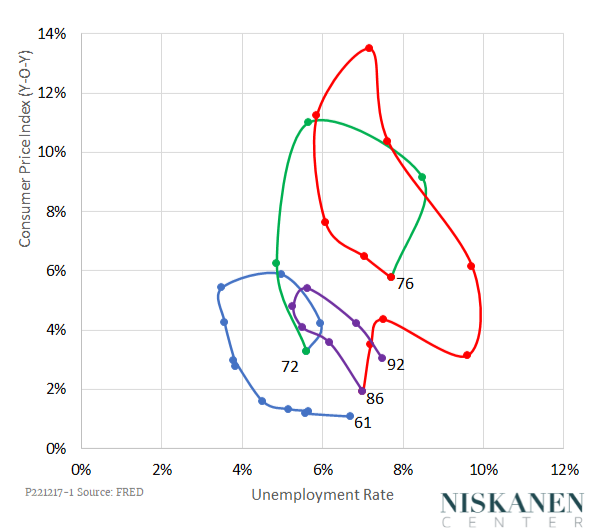
The stagflation of the 1970s was, in a sense, a manifestation of the Phillips curve, but a Phillips curve gone mad, not an orderly one like those of Figure 1. Stagflation was a neologism coined as a name for a combination of high inflation and stagnating employment that can occur when the economy, having reached the peak of the Phillips curve, refuses to slide smoothly back the way it came. Instead of following the Phillips curve, unemployment continues to rise even as inflation continues to its peak and stays high even as inflation declines. As a result, a chart of inflation and unemployment over the 30 years from 1961 to 1992, as shown in Figure 2, is not a simple set of parallel Phillips curves but a series of clockwise loops.
Figure 2: “Stagflation:” 1961-1992
To assess the chance that the current U.S. inflation will turn into stagflation, we need to know a little about the theory behind the movements of prices and employment. I explained that theory in detail in an earlier commentary on this site. To make the long version short, the time-path of the inflation and unemployment rates depends on how workers, consumers, and business leaders form their expectations of future inflation.
Under one version of the story, inflation expectations are anchored. That means people think there is some fixed, normal rate to which they expect inflation to return after any temporary deviation. Suppose inflation expectations are anchored at 2 percent. Starting from that level, any number of things could nudge the inflation rate higher. In the past couple of years, for example, inflation has been pushed up partly by generous federal pandemic benefits, partly by global supply chain disruptions, and partly by the Russia-Ukraine war. But if inflation expectations are anchored, we expect people to behave as if they think inflation will fall again. In that case, firms will continue to hire, and consumers will continue to spend. As inflation recedes, unemployment will remain low or rise only slightly, and the economy will trace out something resembling a classic Phillips curve.
In the other version of the story, inflation expectations break loose from their anchor and become adaptive. By that, we mean that people begin to form their expectations of future inflation not based on some fixed anchor but on their most recent experience. If inflation is rising, they expect it to stay at least as high or to increase even further. If so, inflation becomes self-sustaining. Businesses, expecting their costs to rise, preemptively raise their prices to protect their profits. Workers, expecting the cost of living to rise, preemptively demand wage increases to keep up.
Under conditions of adaptive expectations, if the Federal Reserve raises interest rates to push back against inflation, the economy will enter stagflation. Output will fall and unemployment will rise, but prices, propelled by expectations of future inflation, will continue to increase. Eventually, if the Fed persists, it will win the battle. Inflation will begin to fall, but only at the cost of an uncomfortably deep recession in the real economy.
So, which is happening now? Have inflation expectations remained anchored, or have they become adaptive, dooming us to a bout of stagflation?
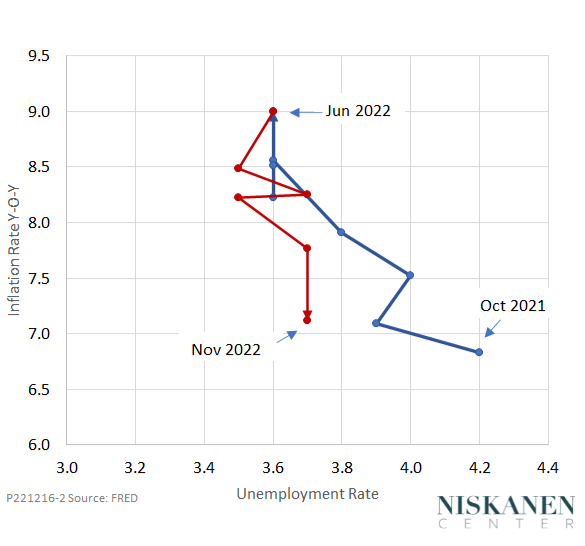
Fortunately, the data from recent months strongly suggest that inflation expectations remain anchored. Figure 3 shows a more detailed picture of what has happened to inflation and unemployment over the past year. From October 2021 to June 2022, unemployment fell as inflation rose, following a classic Phillips curve pattern. Since mid-year, inflation has come down in response to the Fed’s aggressive series of interest-rate hikes. As inflation has fallen, unemployment has increased, but only a bit. There is no sign of a clockwise stagflationary overshoot, as repeatedly happened from the 1960s through the 1980s.
Figure 3 – The Phillips Curve: June 2020-November 2022
Of course, risks remain. A COVID “exit surge” in China could derail supply chains worldwide. An escalation of the Russia-Ukraine war could cause a spike in oil prices. The Fed might overdo it and keep pushing interest rates up further than they should, touching off a deep recession. But so far, so good.
Photo credit: iStock
More By This Author:
Why Perestroika Failed
Fighting Inflation: Can We Learn From Jimmy Carter's Mistakes?
Maybe Inflation Will Be Transitory After All


