Thoughts For Thursday: CPI Keeps The Market In Neutral
CPI figures showed that August inflation came in at 3.7%. This did not cause too, much consternation as it included the much discussed summer increase in gasoline prices which did not make it into the July data.

Still economists were concerned with the rise in core inflation which rose 0.3% in August vs 0.2% in both June and July. It is quite likely that higher energy prices were partially responsible as the increase includes items like higher airfares.
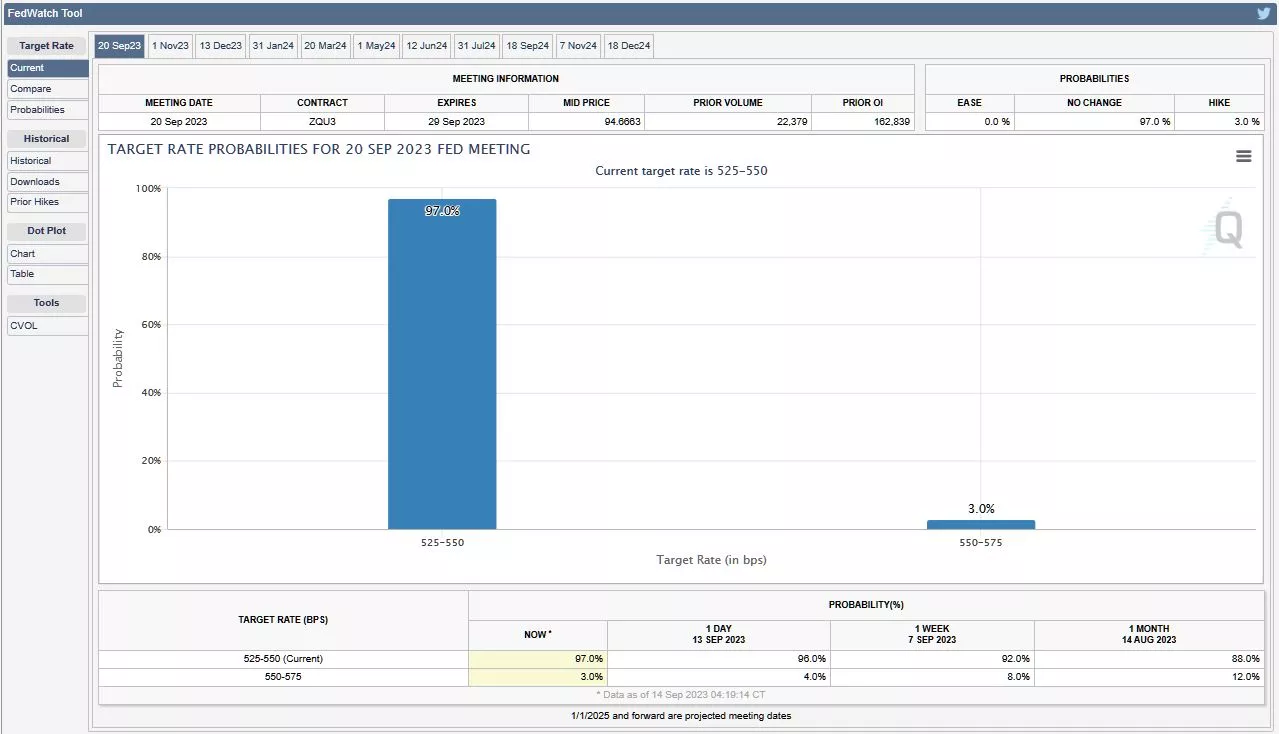
Eyes are now turned toward the Wednesday, September 20, FOMC meeting and the Fed's decision on interest rates. The CME FedWatch Tool currently shows only 3% expect the Fed to raise rates.
Yesterday the S&P 500 closed at 4,467, up 6 points, the Dow closed at 34,576, down 70 points, and the Nasdaq Composite closed at 13,814, up 40 points.

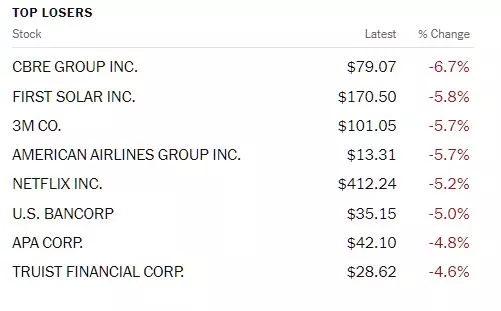
Chart: The New York Times
Leading the top losers on Wednesday was CBRE Group (CBRE), down 6.7% followed by First Solar (FSLR), down 5.8%, and 3M Corporation (MMM), down 5.7%.
In morning futures trading, S&P 500 market futures are trading up 12 points, Dow market futures are trading up 75 points and Nasdaq 100 market futures are trading up 42 points.
As to be expected the rise in the CPI is bringing out the bears.
TM contributor and chartist Tim Knight discusses Analyzing 10 Critical Index Charts: Signs Pointing To A Bearish Turn Ahead In September. I won't post all 10 charts here, but below are some of his insights.
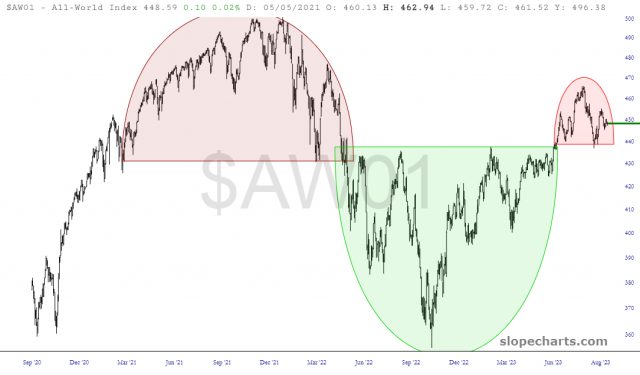
"Now that the monthly CPI is out of the way, let’s take a look at 10 important index charts. I’ve got to say, these are collectively painting a rather exciting bearish picture.
The All World Index is still working on its miniature topping pattern, which is quite clean. if it can get below the low horizontal, the market as a whole is in serious trouble. I would also add that the semiconductor index is also sporting almost exactly the same pattern over the same timespan."
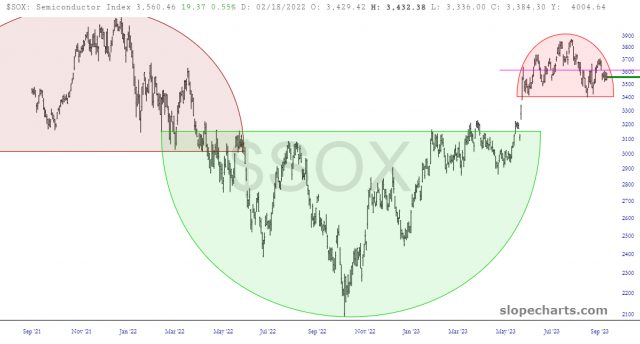
"The semiconductor index has a small topping pattern which looks fantastic so long as (a) the price doesn’t push above the horizontal I’ve drawn within that topping pattern (b) we slip below the low of August 18th. This could bring the whole market down."
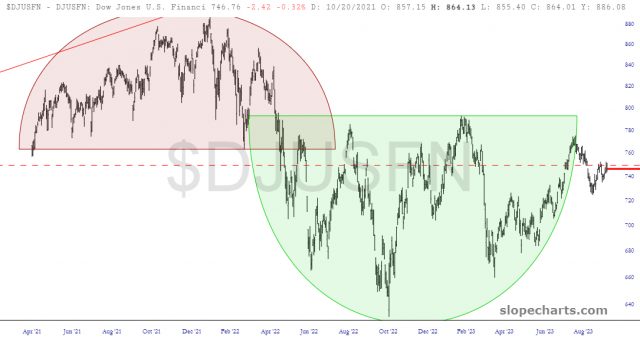
"The Dow Jones U.S. Financial index is particularly interesting, since it features an inverted head and shoulders that terminated itself before it even launched. The stock, itself exceptionally clean, got to about the 98% completion point before it soured. It is now treading water at the dashed red horizontal."
See Knight's full post for the other seven charts.
Contributor James Harte reminds readers that we have ECB On Deck for a rate hike decision, at 8:15 am, Eastern time, this morning. It's a bit of a toss up, with about 65% suggesting the ECB will pull for a rate hike.
"All eyes are firmly on the ECB today as the central bank prepares to make its September rates decision. Expectations have been rather split ahead of this event...
Still, even if the ECB does hike today, the upside reaction will likely be limited for EUR (FXE) with traders sensing that a further hike at this point would likely be the last or nearly the last. Today’s meeting is likely to show much greater dissent between hawks and doves and, as such, the EUR looks vulnerable to a fresh downside on the back of the meeting. Obviously if the bank refrains from hiking at this point, the sell-off will be stronger. In terms of bullish scenarios, the bank would need to hike while striking a unified front in signaling further tightening will likely be needed. Anything except this scenario is likely to result in EUR weakening near-term even if we get a knee-jerk pop higher today.
Technical Views
EURUSD
_638302786437405694.webp)
The sell off has seen the market breaking down below the rising trend line from YTD lows. Price has now broken below the 1.0785 level also and, while below here, the focus is on a further push lower in line with bearish momentum studies readings. The next support to watch will be the 1.0515 level."
Despite the recent increases in crude oil prices, contributor Christian Borjon Valencia notes a WTI Pullback On Surprising US Inventory Build, Strong USD.
"Western Texas Intermediate (WTI), the US crude oil, trims some of its daily gains spurred by a build on US oil inventories amid expectations for a drop."
"WTI retreated amid unexpected surge in US inventories, rising US Dollar
The latest US crude oil inventories showed an increase of 4 million barrels last week, crushing estimates gathered by a Reuters poll for a 1.9 million barrel contraction, in data revealed by the US Energy Information Administration (EIA). Additional data showed that fuel demand dropped as the summer driving period in the US ended in the September 4 Labor Day Holiday.
The latest inflation report in the US showed headline inflation rose by 3.7% YoY in August, above estimates propelled by a 10.6% increase in retail gasoline prices. Contrarily, excluding volatile items like food and energy, inflation slowed from 4.7% to 4.3% YoY.
Oil prices had remained underpinned by Saudi Arabia and Russia’s voluntary oil production cut as both countries slashed 1.3 million barrels from the market.
WTI Price Analysis: Technical outlook
After rising to a 10-month high, WTI retraced below the September 12 daily close of $88.18 per barrel. A daily close below that level could pave the way for a pullback toward the top of an ascending-triangle top-trendline turned support at $87.23 before slumping to the $87.00 figure. A breach of the latter will expose the September 8 daily low of $85.65, ahead of slumping below the $85.00 figure. Conversely, WTI’s first resistance would be the $88.00 figure before cracking the YTD high of $88.99."
In a TalkMarkets Editor's Choice column, contributor Michael Lebowitz discusses The Lag Effect Unveiled.
"Despite surging interest rates, there are few signs they are impeding economic activity or causing distress amongst borrowers. It may seem strange that higher rates are not proving troublesome for an economy with such a high amount of leverage. Don’t breathe a sigh of relief quite yet. There is often a delay, called the lag effect, between higher interest rates and economic weakness.
Changes in interest rates only impact new borrowers, including those with maturing debt who must reissue debt to pay back investors of the maturing bonds. Accordingly, higher rates do not impact those with fixed-rate debt that is not maturing. The lag effect occurs due to the time it takes for the new debt issuance to bear enough weight on the economy to slow it down.
The graph below shows the Fed Funds rate and the time, as measured in months, from the last in a series of rate hikes preceding each recession since 1981. The average delay between the final rate increase and recession has been 11 months. The last Fed hike was in July 2023. Assuming that was the Fed’s final rate increase for this cycle, it may not be until June 2024 before a recession occurs."
![]()
"This so-called lag effect is even more pronounced when rates were very low for extended periods before the rate hikes."
See the full article for the complete deep dive.
TM contributor Sheraz Mian is Looking Ahead To Q3 Earnings.

"The aggregate Q3 earnings estimate for the S&P 500 index has declined about -1% since the start of the period, with rising estimates for six sectors, including Tech, offsetting continued weakness of varying magnitudes in the remaining sectors.
Had it not been for the continued pressure on Energy sector estimates, the revisions trend for Q3 for the S&P 500 index would be modestly positive since the start of the period.
In addition to the Tech sector, Q3 estimates have moved higher for the Construction, Autos, Medical, Retail, and Industrials sectors.
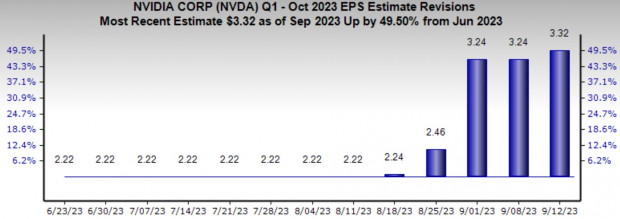
For the Tech sector, you can see this favorable revisions trend in estimates for operators like Meta Platforms (META), Alphabet (GOOGL), Nvidia (NVDA), and others.
The magnitude of positive revisions that Nvidia is experiencing is in a league of its own, as the chart below shows.
Source: Zacks Investment Research
But the gains in estimates at Alphabet, Meta, and others are as material and indicative of the overall improving earnings outlook.
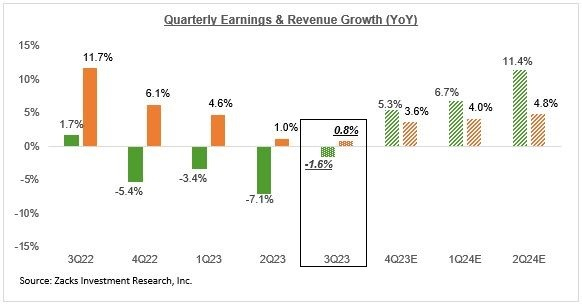
The chart below shows the overall earnings picture on a quarterly basis.
Source: Zacks Investment Research
As you can see from these quarterly earnings-growth expectations, the long-feared recession doesn’t show up in this near-term earnings outlook. A big-picture view of corporate profitability on a long-term basis doesn’t leave much room for a recession either, as you can see in the chart below.
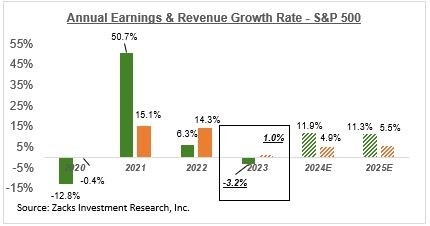
Source: Zacks Investment Research
Given the emerging consensus on the ‘soft-landing’ outlook for the economy, one can expect this favorable turn in the overall earnings picture to strengthen further as companies report Q3 results and share trends in underlying business."
That's a good place to end, for today.
To all who celebrate the Jewish New Year, wishing you and yours, "L'Shanah Tovah U'Metukah", A Happy (Good) and Sweet New Year.

More By This Author:
Tuesday Talk: Neutral Positive Energy
Thoughts For Thursday: Oil Prices Bring On The Blues


