
Now that the monthly CPI is out of the way, let’s take a look at 10 important index charts. I’ve got to say, these are collectively painting a rather exciting bearish picture.
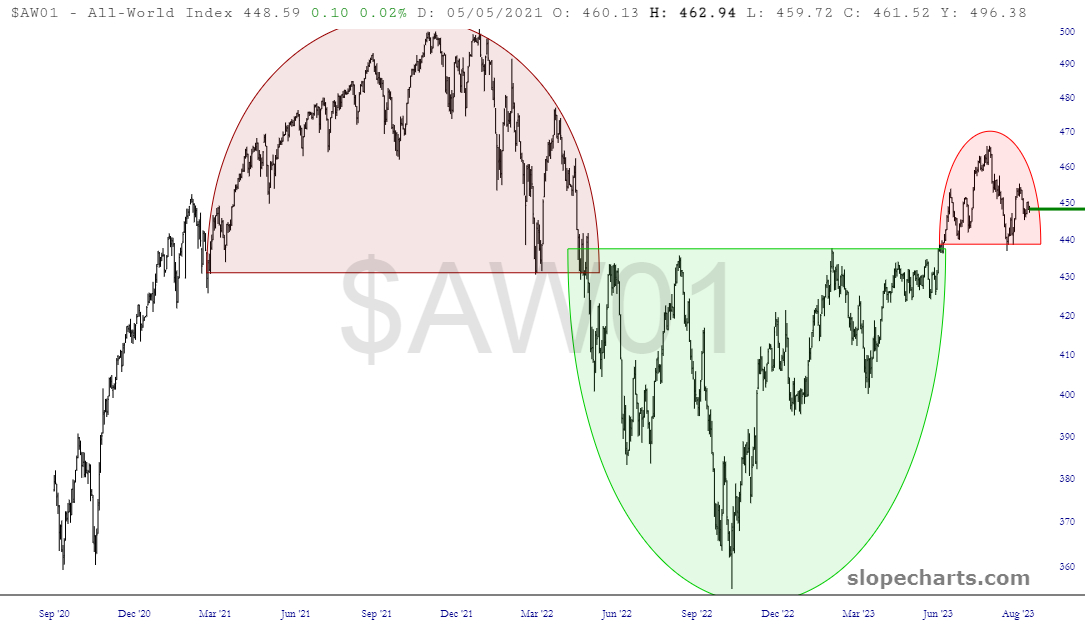
The All World Index is still working on its miniature topping pattern, which is quite clean. if it can get below the low horizontal, the market as a whole is in serious trouble. I would also add that the semiconductor index is also sporting almost exactly the same pattern over the same timespan.
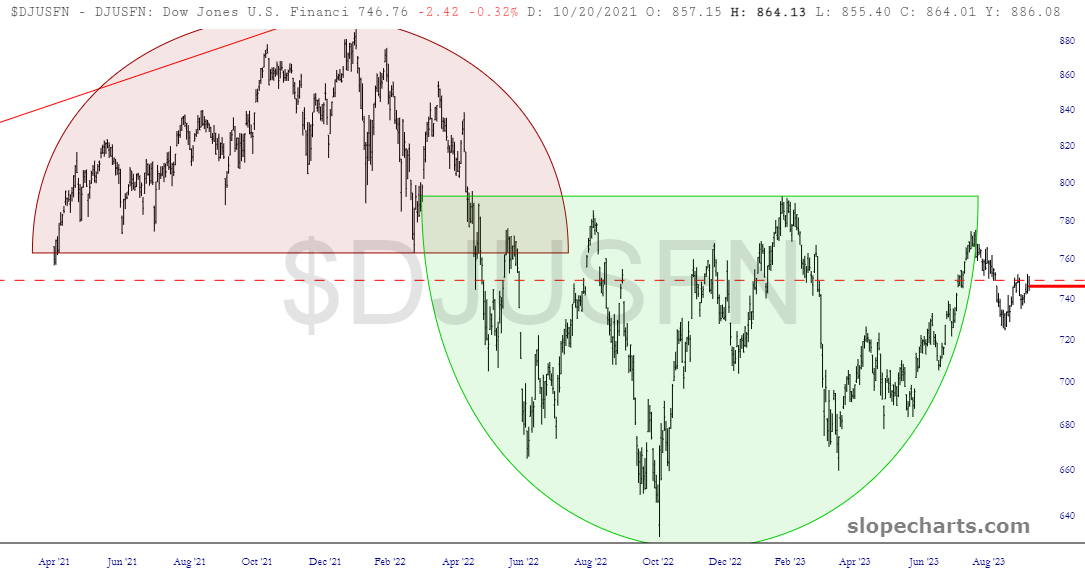
The Dow Jones U.S. Financial index is particularly interesting, since it features an inverted head and shoulders that terminated itself before it even launched. The stock, itself exceptionally clean, got to about the 98% completion point before it soured. It is now treading water at the dashed red horizontal.
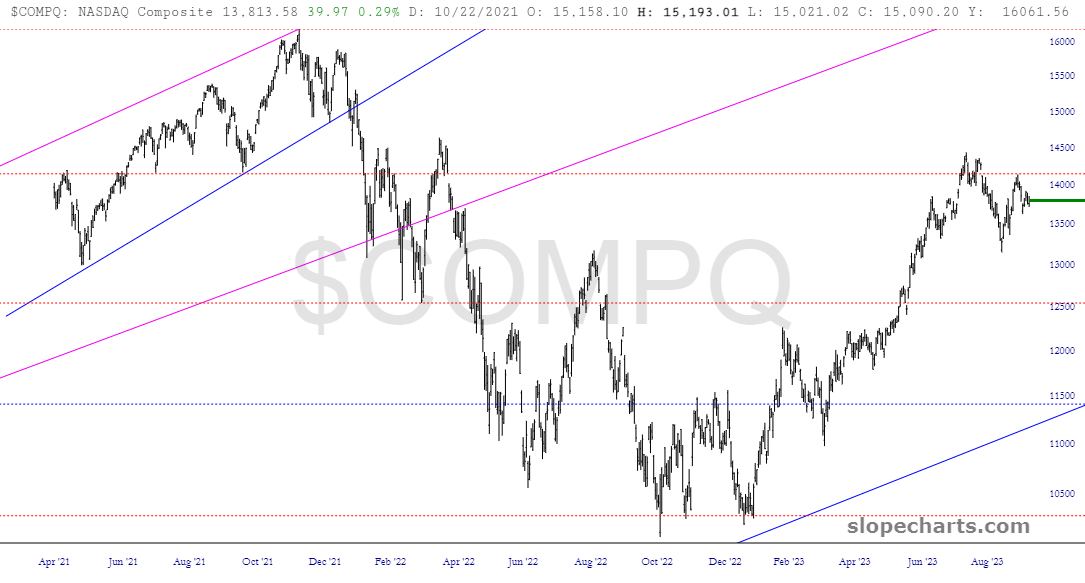
Fibonaccis are dictating support/resistance for the NASDAQ Composite. We are beneath a major Fib right now, leaving open the prospect of descending to the next major Fib level beneath.
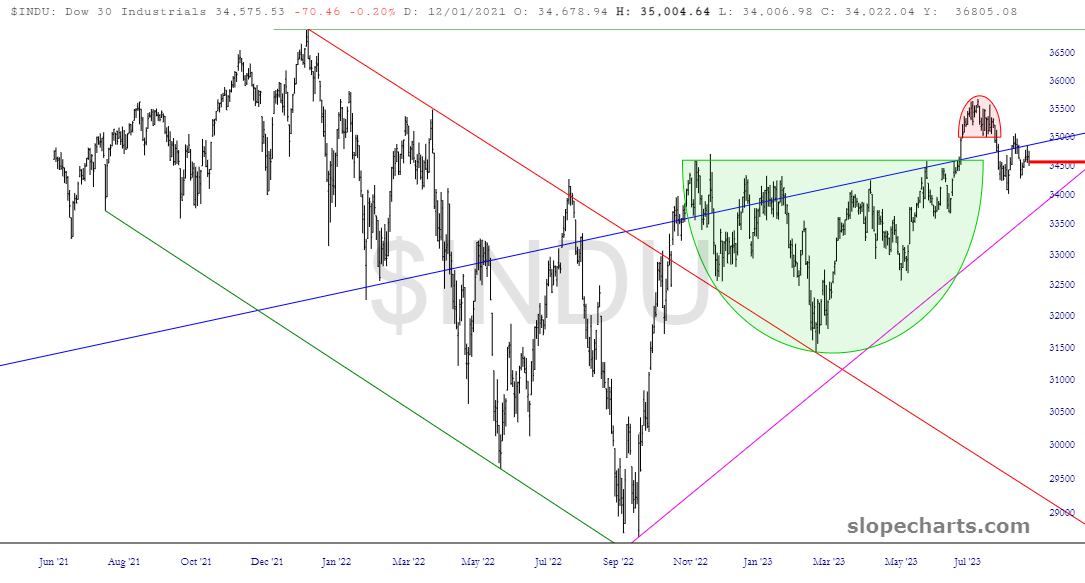
The Dow 30 also had a very clean, bullish inverted H&S reversal pattern, and unlike the Financials, it actually completed it and shot higher. However, it had its own pee-wee sized top (in pink) and is now in a state of tepid equilibrium at roughly the same horizontal as what constituted the neckline of the IHS bullish pattern.
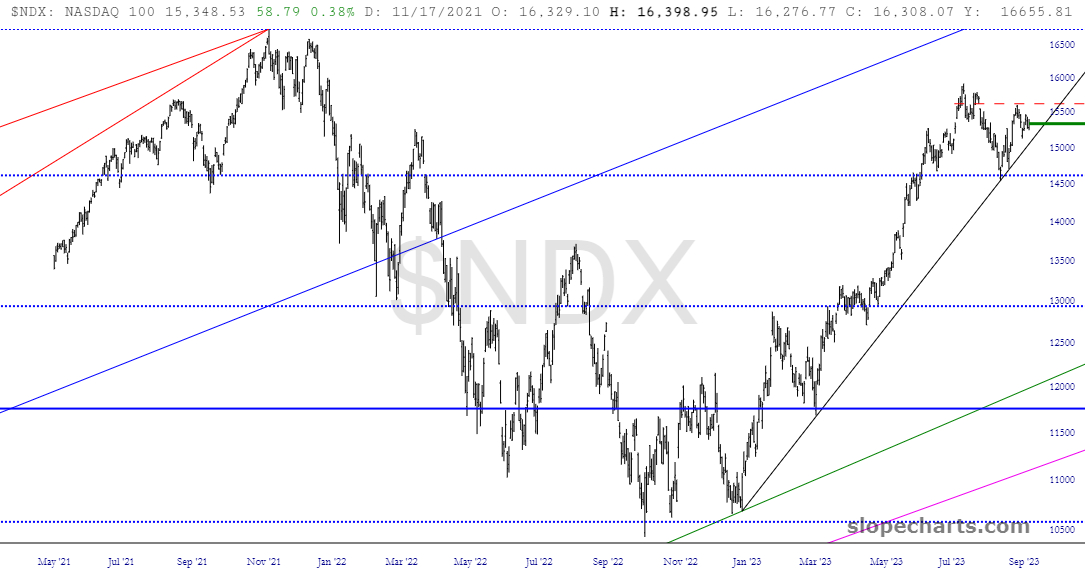
What I’m watching most closely on the NASDAQ 100 index is that sharply ascending trendline, It would only take a single strong down day to break it, which would be its full first for the entirety of the year 2023.
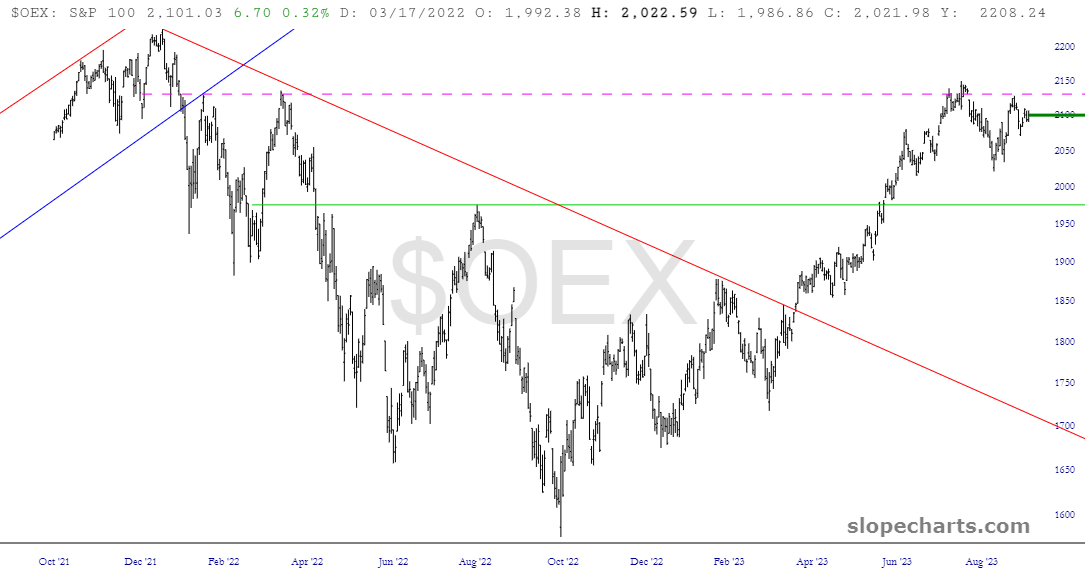
The S&P 100 has the easiest downside potential between present price levels and the dashed horizontal.
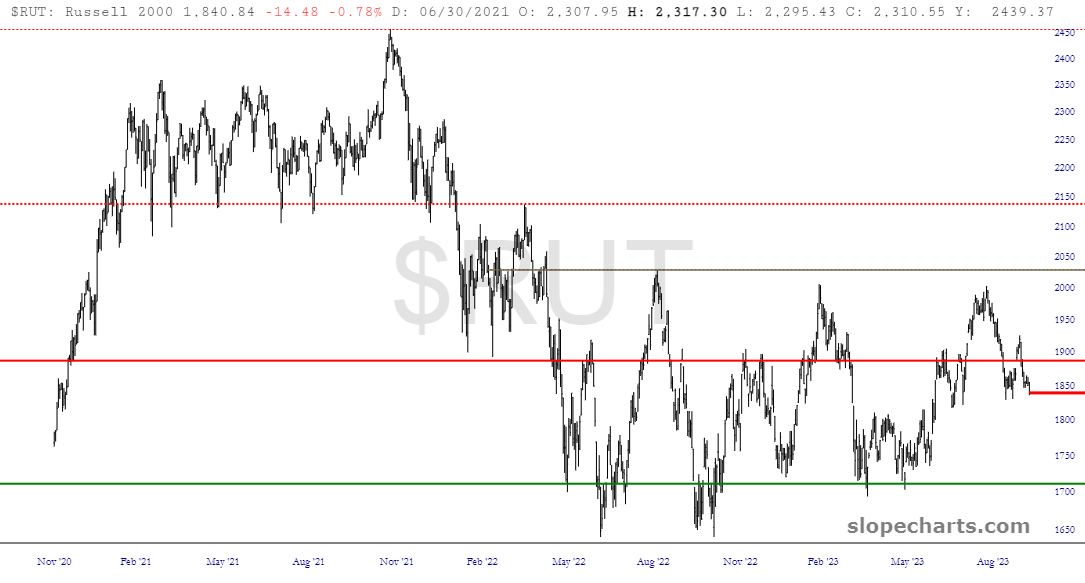
The small caps (Russell 2000) has been in a sinewave for nearly two years now, and we will hopefully match the lows witnessed last March once more.
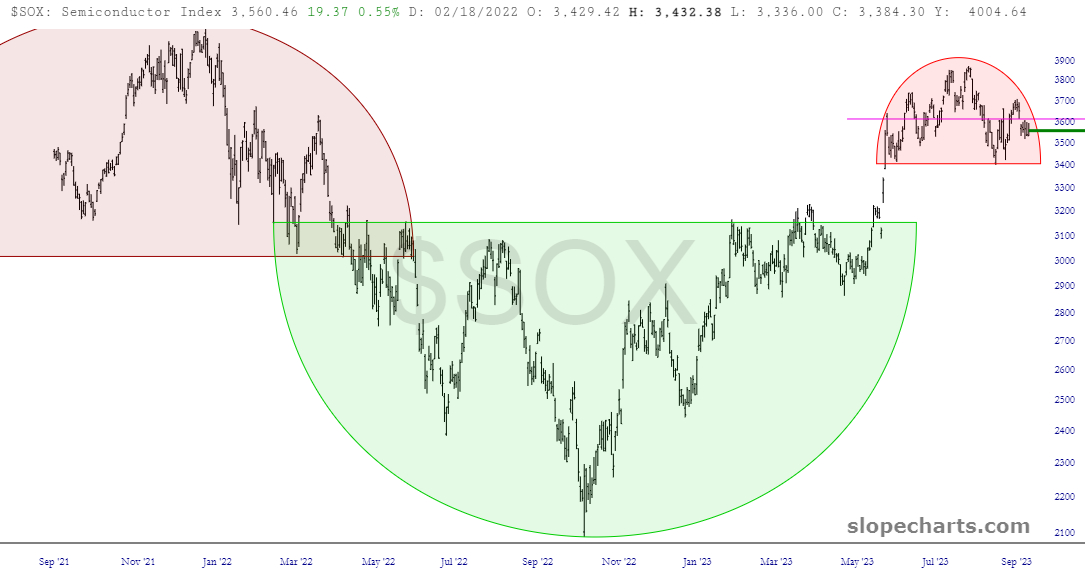
As mentioned at the top of this post, the semiconductor index has a small topping pattern which looks fantastic so long as (a) the price doesn’t push above the horizontal I’ve drawn within that topping pattern (b) we slip below the low of August 18th. This could bring the whole market down.l
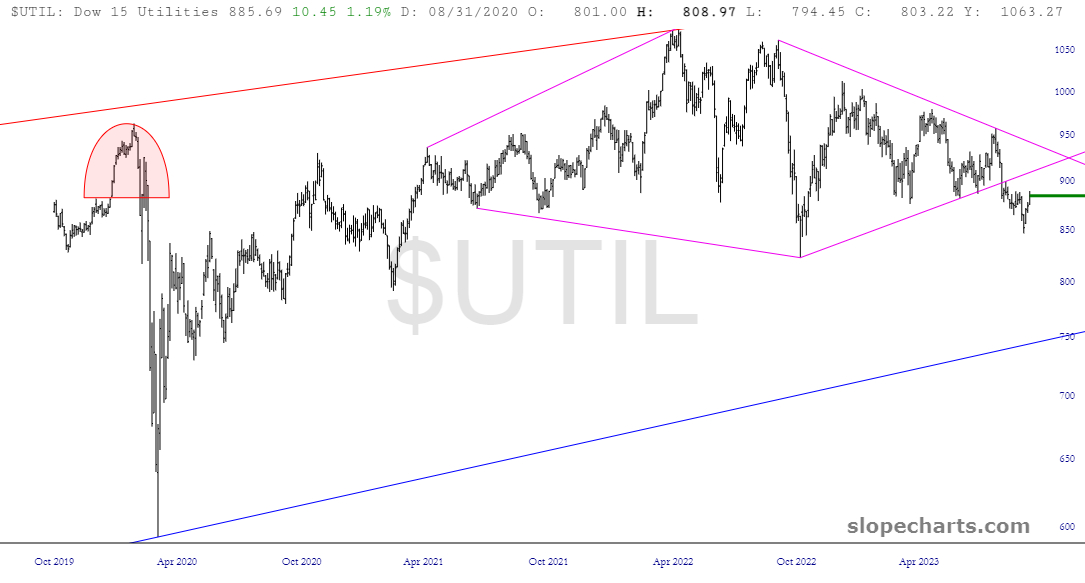
Of course, the Utilities are always on my radar, and I did a post dedicated specifically to this trade for premium members earlier on Wednesday.
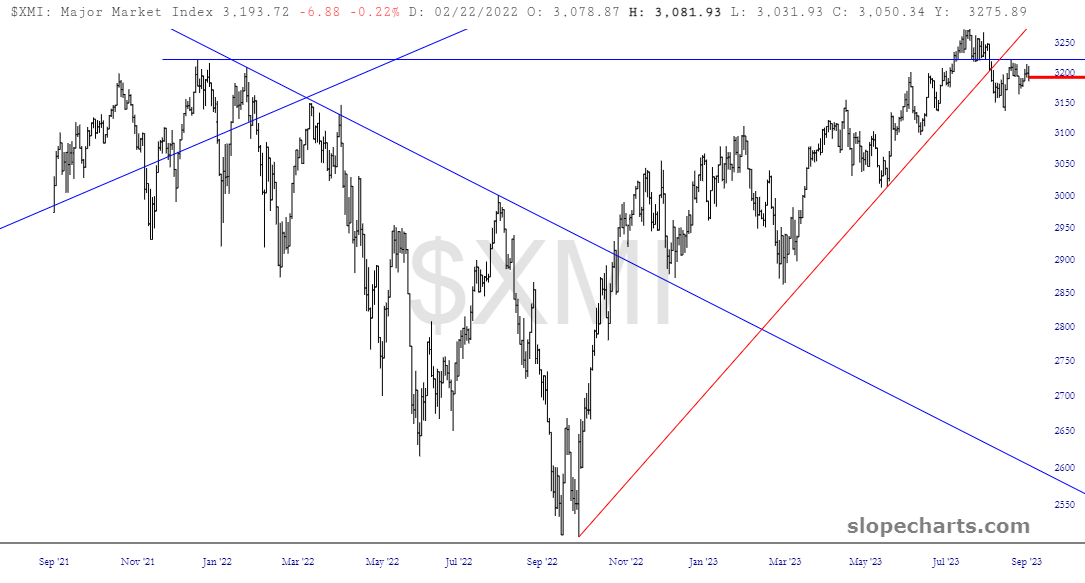
Lastly, the Major Market Index has already busted its trendline, anchored all the way back to the Rolo Low, and seems poised, as the rest of these charts do, to affirm September’s well-established reputation for sell-offs. Next week could be one of the best of the year!
More By This Author:
This Fib Is HoldingSo What’s Next?
Tesla’s New Range


Comments
Log in or sign up to join the conversation.