
One of the enduring mysteries of the past two years is why measured economic sentiment remains so sour despite objectively good economic outcomes.
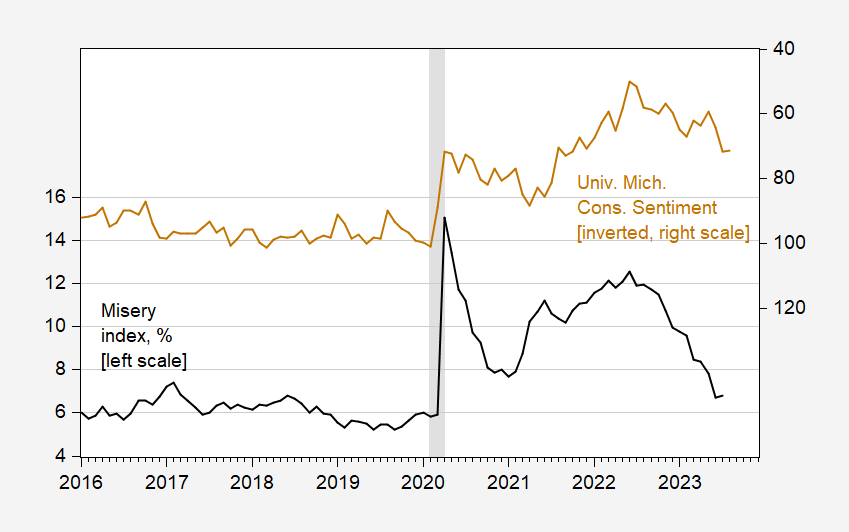
Figure 1: Misery index sum of unemployment and inflation rate, % (black, left scale), and U.Michigan consumer sentiment index, inverted (tan, right scale). Inflation rate is CPI y/y growth rate. NBER defined peak-to-trough recession dates shaded gray. Source: BLS, U.Michigan via FRED, NBER, author’s calculations.
One thing to realize is that there are actually three different groups in the Michigan sample. The disaggregated results — for Dem/Dem lean, Independent, Rep/Rep lean — are only reported occassionally, although with greater frequency in recent years.
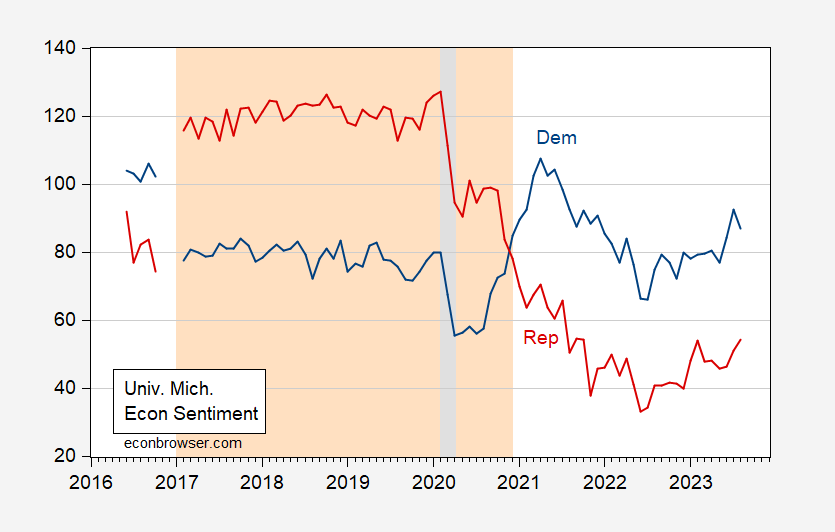
Figure 2: U.Michigan consumer sentiment index for Dem/Dem lean (blue), for Rep/Rep lean (red). Light orange shading denotes Trump administration. NBER defined peak-to-trough recession dates shaded gray. Source: U.Michigan, NBER, author’s calculations.
Note that there is an obvious switch in sentiment with the end of the Trump administration, and the beginning of the Biden, that seems unrelated to changes in aggregate economic conditions (although this is not to say inflation and unemployment don’t affect measured sentiment).
This is confirmed by the following regressions (2008M01-2023M06), for Dem sentiment and Rep sentiment:
SentDem = 103.33 – 1.92u – 1.85π -28.76GWBush – 13.02Trump + 1.52Biden – 38.6Covid
Adj.-R2 = 0.48, SER = 9.046, DW = 0.42, Nobs = 109. Bold (underline) denotes significant at 10% msl (15%) using HAC robust (Newey-West) standard errors.
Where Sent is the University of Michigan sentiment index, u is the unemployment rate, π is the 12 month CPI inflation rate, Covid is the Covid death rate per 1000 population, 2020M01-2021M06, and 0 otherwise. GWBush, Trump, and Biden are dummy variables for each administration (Obama is the omitted dummy, so the constant can be interpreted as the average value holding all else constant, during the Obama administration.)
SentRep = 102.71 – 4.03u – 1.62π -3.84GWBush + 34.64Trump – 26.87Biden + 27.4Covid
Adj.-R2 = 0.91, SER = 9.16, DW = 0.70, Nobs = 109. Bold denotes significant at 10% msl using HAC robust (Newey-West) standard errors.
Interestingly, sentiment is unaffected by Covid dealths per capita for both groups, in terms of statistical significance.
In quantitative terms, Democrats really viewed GWBush and Trump administrations as negatives for sentiment, while Republicans had outsized pluses for Trump and outsized negatives for Biden.
If Dem/Dem lean and Rep/Rep lean had equal and opposite signs for dummy coefficients on Trump and Biden, and Dem/Dem lean and Rep/Rep lean had equal weight in the overall index, then one would not expect a differential effect. However, the Rep/Rep lean Trump coefficient is nearly 3 times that for Dem/Dem lean (in absolute value). In addition, while Biden has a positive coefficent for Dem/Dem lean, the (absolute value of the) quantitative magnitude (1.5) is dwarfed by that for Rep/Rep lean of 26.9(!).
Hence, while Rep/Rep lean have about 24% weighting and Dem/Dem lean have about 34% (about 46% Ind), the intensity of the Rep/Rep lean feelings explains a big chunk of the overall measure.
Another way of seeing the outsized effects of who holds the presidency on Rep/Rep lean sentiment is to look at 12 month changes in UMCSENT, decomposed into proportions attributable to each group.
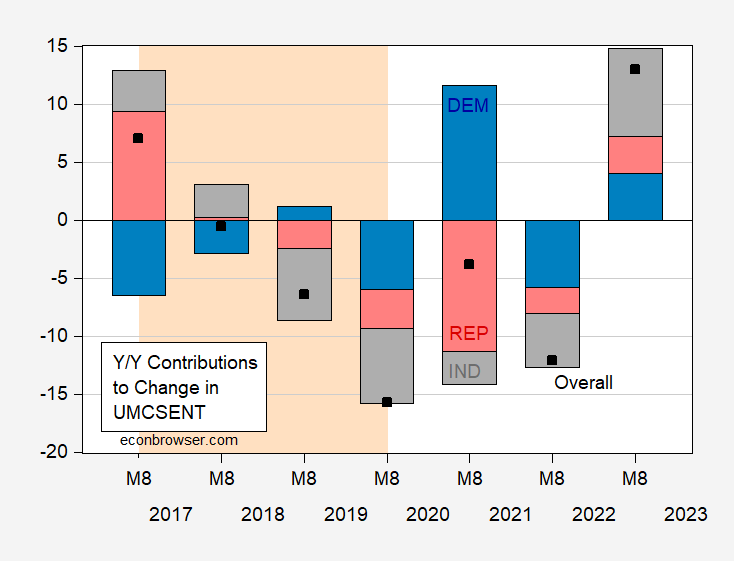
Figure 3: Change in U.Michigan consumer sentiment August to August (black square), contribution from Dem/Dem lean (blue bar), from Rep/Rep lean (red bar), from Independent (gray bar). Light orange shading denotes Trump administration. Source: U.Michigan, author’s calculations.
Figure 3 highlights the big switch in Rep sentiment associated with Trump’s ascension in 2017, and the other big switch (opposite direction) associated with Biden’s ascension in 2021. While Dem/Dem lean have large contributions, they are not as large as the Republican shifts. The outsized Rep impact is even more impressive when one recalls the Rep/Rep lean weight is 24% (vs. 34% for Dem/Dem lean).
More By This Author:
Q3 GDP Now At 5.9% (SAAR)
Divisia M4 And The Price Level
QCEW Release And 4 Measures Of NFP Employment


Comments
Log in or sign up to join the conversation.