
To see how dramatically this bean counting approach deviates from consensus, consider this graph:
(Click on image to enlarge)
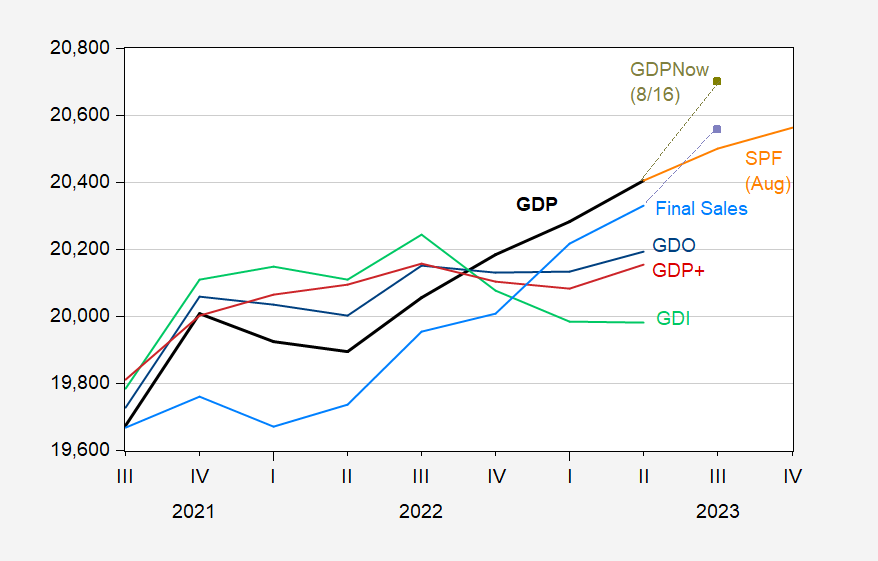
GDP (bold black), GDP Now as of 8/24 (chartreuse square), GDI (light green) GDO (blue), GDP+ (red), final sales (light blue), final sales GDPNow as of 8/24 (lilac square), Survey of Professional Forecasters August survey median (orange), all in bn.Ch.2012$ SAAR. GDO assumes net operating surplus drops $100 bn SAAR in Q2. GDP+ level GDP+ growth rates iterated on 2019Q4 GDP. Source: BEA 2023Q2 advance, Atlanta Fed (8/24), Philadelphia Fed (7/28), Philadelphia Fed, and author’s calculations.
GDI is not available for 2023Q2, but all but one major component of GDI (net profit) is reported. Assuming net profit falls by $100 billion (SAAR) in Q2, I estimate Q2 GDO in Figure 1.
Note that final sales are also forecasted to be rising, so the outsized GDP nowcast is not primarily due to inventory accumulation. Over half of the growth is attributed to consumption growth.
One interesting aspect of the results is the (predicted) end of the nonresidential investment boom.
(Click on image to enlarge)
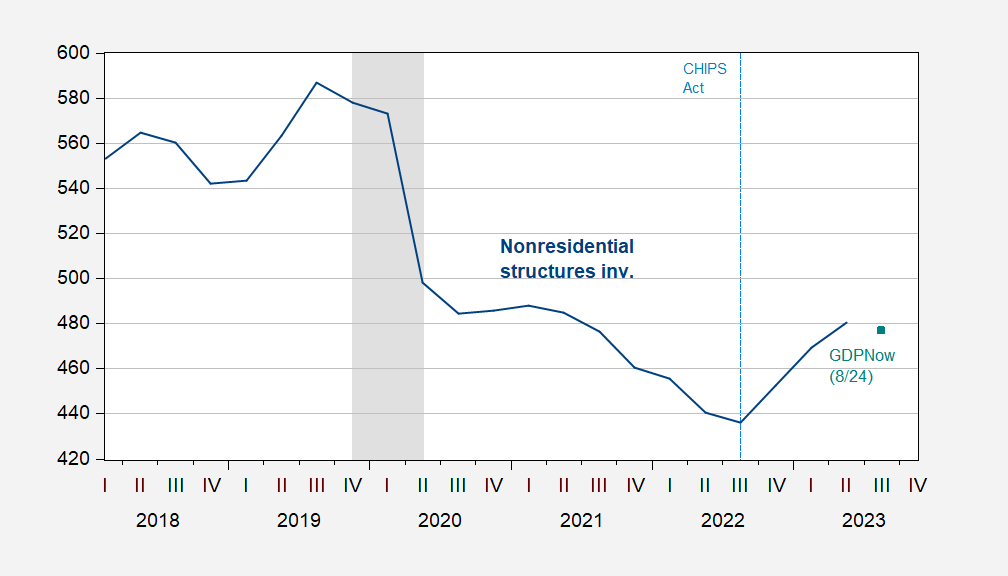
Nonresidential fixed investment in structures (blue), and GDPNow of 8/24 nowcast (teal square), all in bn.Ch.2012$, SAAR. NBER defined peak-to-trough recession dates shaded gray. Source: BEA, Atlanta Fed (8/26), NBER.
More By This Author:
Divisia M4 And The Price LevelQCEW Release And 4 Measures Of NFP Employment
The Return Of The Economic Undead


Comments
Log in or sign up to join the conversation.