
Posit money includes everything in M1-M3 and Treasurys per John Hall (says use broad divisia aggregate). Estimate a regression of log GDP deflator divided by Divisia M4 and real GDP over the 1967-2019 period (Engle-Granger).
p = 8.11 + 1.33(m4-y)
p is the log GDP deflator, m4 is log divisia M4 including Treasurys, and y is log real GDP.
Johansen cointegration tests indicate up to 3 (!) cointegrating vectors when p, m4 and y are entered separately. Given this result, I’ll just use the E-G results which seem more sensible. This yields the following fitted values.
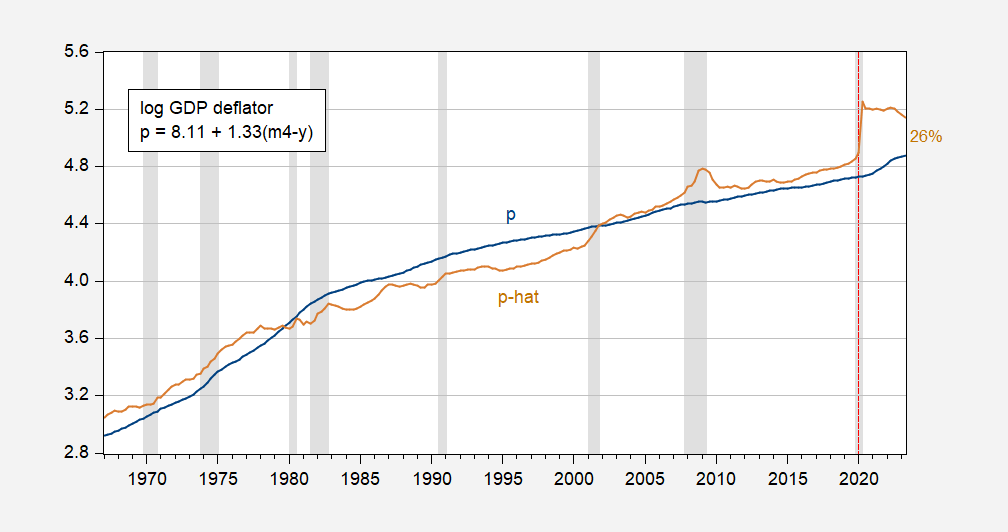
Figure 1: Log US GDP deflator (blue), and fitted values (brown). NBER defined peak-to-trough recession dates shaded gray. Source: BEA 2023Q2 advance release, NBER, and author’s calculations.
So when people (well, Econned) laud the success of what one person calls the ecological Quantity Theory of Money, I say, just look at the data! The predicted price level is 26% higher (in log terms; bigger if we base it on current price level).
More By This Author:
QCEW Release And 4 Measures Of NFP Employment
The Return Of The Economic Undead
US GDP Deflator, Broad Money, And Velocity


Comments
Log in or sign up to join the conversation.