
Some pictures, for those who believe in the constant or trend velocity Quantity Theory for the US.
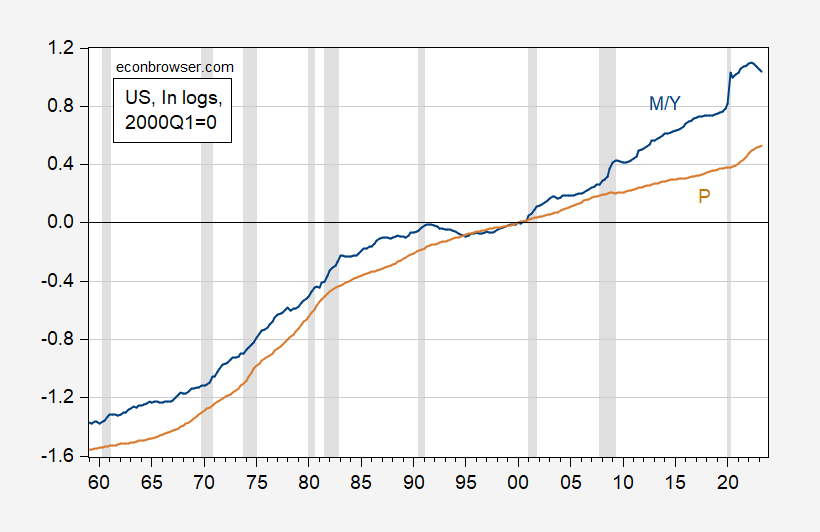
Figure 1: Log M2 divided by real GDP (blue), log GDP deflator (tan), both 2000Q1=0. NBER defined peak-to-trough recession dates shaded gray. Source: BEA, Federal Reserve Board via FRED, NBER, and author’s calculations.
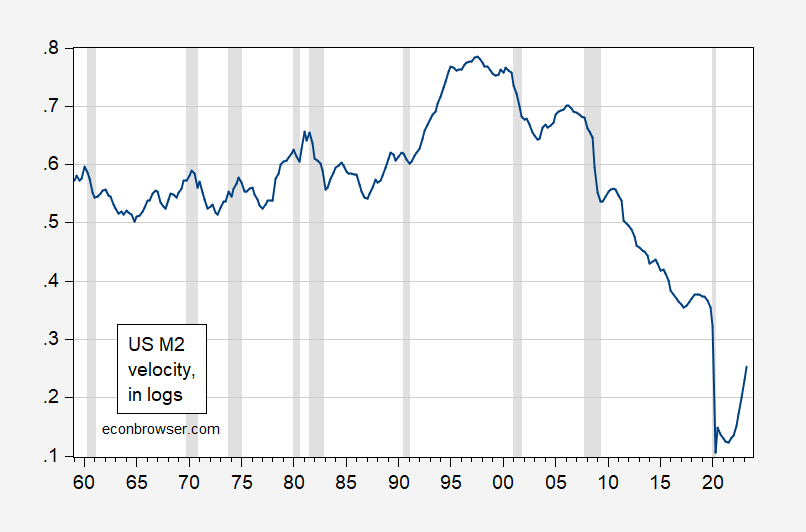
Figure 2: Nominal GDP divided M2 (blue), in logs. NBER defined peak-to-trough recession dates shaded gray. Source: BEA, Federal Reserve Board via FRED, NBER, and author’s calculations.
These graphs highlight the fact that a cross-country graph of money and price growth over the past 40 years, including high-inflation countries such as Turkey, Brazil and Argentina, will miss large deviations within countries, particularly those with (relatively) small monetary shocks.
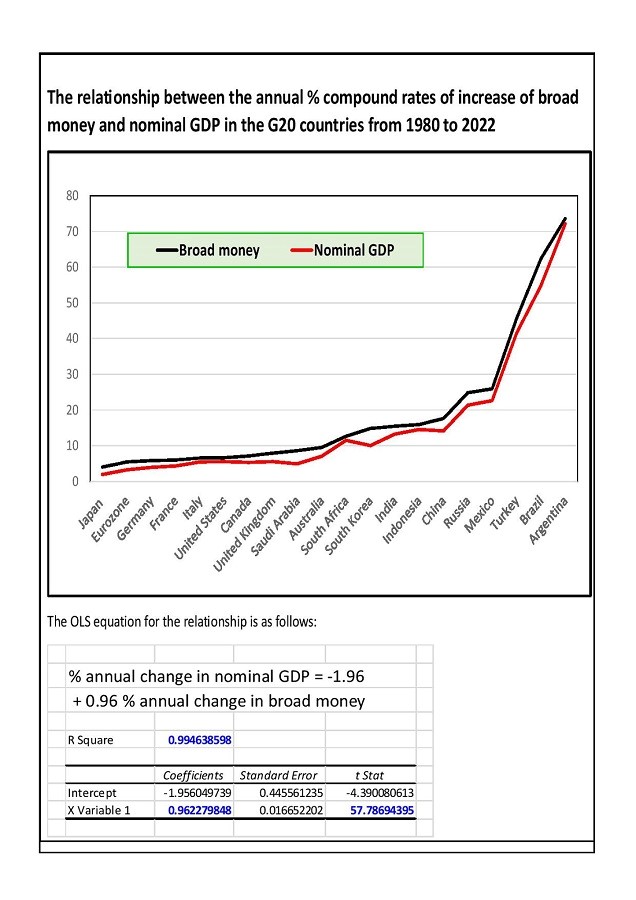
Source: Tim Congdon, Institute of International Monetary Research, August 21, 2023.
More By This Author:
Russia’s Current Account Surplus DisappearsChina Downside Surprises
Two Graphs Of Real Rates


Comments
Log in or sign up to join the conversation.