The 2022H1 Recession Call In Hindsight, The 2023H2 Call In Context

Back at the beginning of this year, Mr. Steven Kopits asserted that the Philadelphia Fed’s early preliminary benchmark supported a recession in 2022H1, to wit:
You, Menzie, held the Est Survey was more likely right. You wrote: So: (1) I put more weight on the establishment series, and (2) the gap between the two series is more likely due to increasing, and biased, measurement error in the household series, rather than, for instance, primarily increases in multiple-job holders. https://econbrowser.com/archives/2022/12/the-household-establishment-job-creation-conundrum
Dead wrong, as it turned. And predictably so.
You were wrong because you did not consider the statistics more holistically. That’s the learning point for your students. Cross check your indicators if you have dials which are telling you different things. If jobs are increasingly rapidly, then GDP should also be up. If jobs are increasing rapidly, then mobility and gasoline consumption should also be up, because so many people need to drive to work in this country. Finally, if productivity is imploding when jobs are up, you really need to take a pause and put together some sort of narrative as to why that might be happening. It suggests something anomalous in the data which requires closer inspection.
Had you done that, Menzie, you might have concluded as did the Philly Fed…
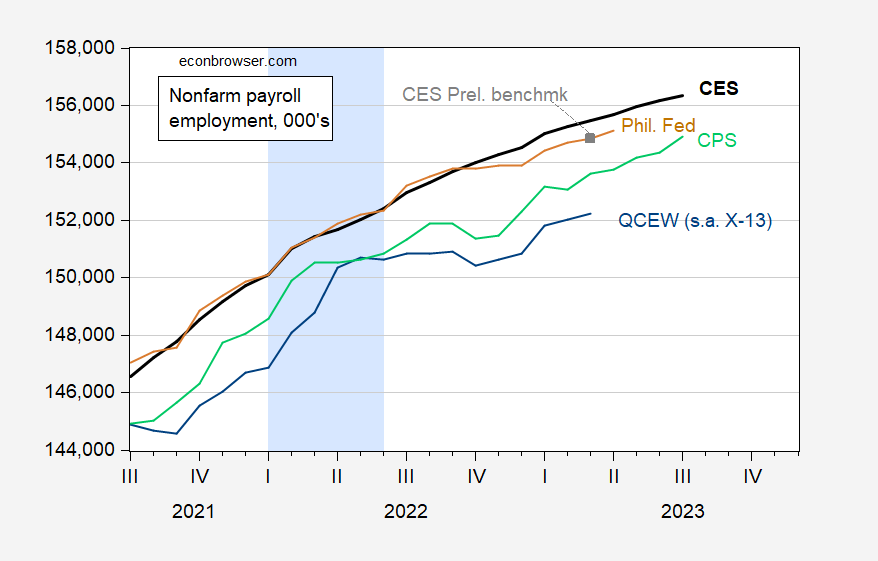
With newly released QCEW data (which is used by the Philly Fed to generate its early benchmark), what do we now think happened in the labor market in 2022H1?
Figure 1: Nonfarm payroll employment, FRED series PAYEMS (bold black), preliminary benchmark (gray square), sum of states early benchmark by Philadelphia Fed (tan), civilian employment over age 16 adjusted to NFP concept (light green), Quarterly Census of Employment and Wages total covered employment, adjusted by log Census X-13 by author (blue), all in thousands, seasonally adjusted. Light blue shading denotes hypothesized (by Mr. Steven Kopits) 2022H1 recession. Source: PAYEMS from BLS via FRED, civilian employment adjusted to NFP concept from BLS, QCEW from BLS, BLS, sum of states early benchmark data from Philadelphia Fed.
Note that the preliminary benchmark revision did not alter qualitatively the trajectory of nonfarm payroll employment.
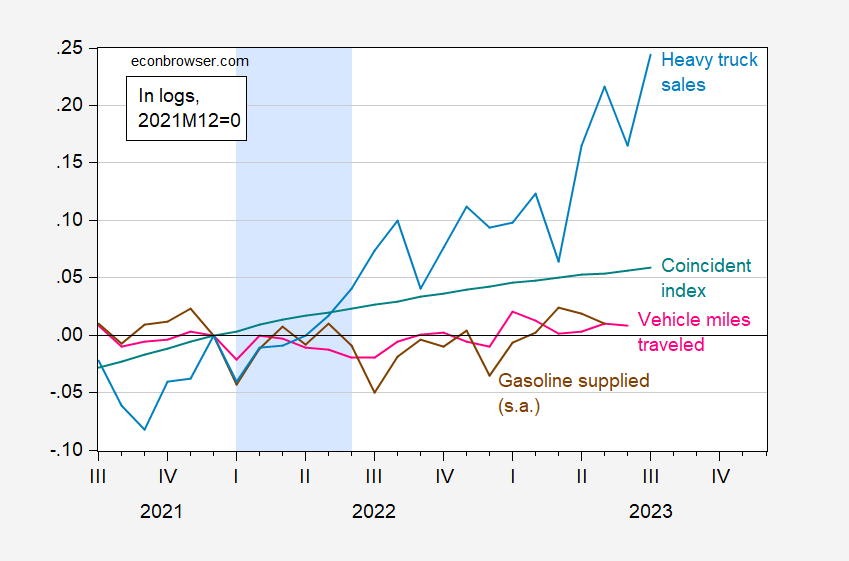
What about other indicators Mr. Kopits signalled as being important predictors? Figure 2 presents vehicle miles traveled as well as gasoline product supplied (consumption is highly correlated, regression coefficient of one, so it’s a proxy for that as well).
Figure 2: Vehicle miles traveled (pink), motor gasoline supplied (brown), heavy truck sales (light blue), coincident index for US (teal), all in logs, seasonally adjusted. Gasoline supplied seasonally adjusted using multiplicative moving averages. Light blue shading denotes hypothesized (by Mr. Steven Kopits) 2022H1 recession. Source: VMT, heavy truck sales, via FRED, motor gasoline (n.s.a.) from EIA, coincident index from Philadelphia Fed via FRED.
Notice that every index in Figure 1 was rising from 2021M12 to 2022M06. VMT provided I think a false signal (presuming NBER does not declare a recession in 2022H1). Gasoline supplied also seems to have indicated a lackluster growth in the past year. On the other hand, conventional indicators such as the Philadelphia Fed’s coincident index continued its rise. Heavy truck sales were nearly 5% higher at mid-2022 than at end-2021.
The high and rising value of the heavy truck sales index suggests to me a recession had not occurred as of June 2023. But no guarantees on 2023H2.
More By This Author:
2.5% Russian GDP Growth In 2023: Finance MinisterThe Problems With China’s Economy…
The Atavistic Component Of Consumer Sentiment


