
Following futures positions of non-commercials are as of August 6, 2024.
10-year note: Currently net short 776.2k, up 47.7k.
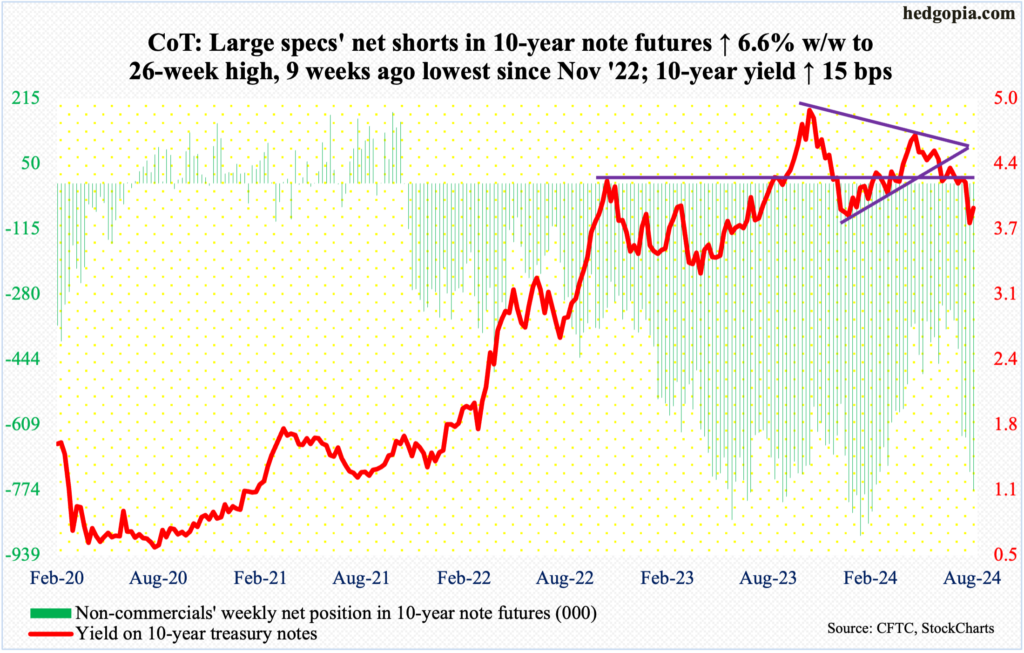
At 3.94 percent, the 10-year treasury yield remains under four percent but is substantially off Monday’s intraday low of 3.67 percent – a level that truly reflected the prevailing growth scare. That fear is not completely gone, but a rally in stocks as the week progressed improved sentiment overall.
At one time early this week, there were calls for a 75-basis-point cut in an emergency Federal Reserve meeting. Pure comedy! One weaker-than-expected jobs report for July and people go on TV asking for an emergency meeting. As a matter of fact, it was not the jobs report that induced this absurdity. It was the selloff in stocks that prompted the call. At Monday’s low, the S&P 500 was less than 10 percent lower from its record high from last month. These people forget that through the July 16th high, the index jumped 38.2 percent from last October’s low.
Unhealthy rallies are just that – unhealthy. Markets go up, and markets go down. History has taught us repeatedly that parabolic moves seldom last – be it on the up or down. Investor sentiment for months has remained lopsidedly bullish, and the recent selloff has helped unwind part of it. This is no reason to put undue pressure on the Fed, which does have a tough job of creating a balance between jobs and inflation.
Hopefully, the Jerome Powell-led Fed is not shackled by the so-called Fed put. Since the time of Alan Greenspan and through the leaderships of Ben Bernanke and Janet Yellen, the central bank has tended to acquiesce to market demands for easier policy the moment stocks come under pressure. This may help stabilize things in the short term but only distorts the markets and cause more pain in the long run.
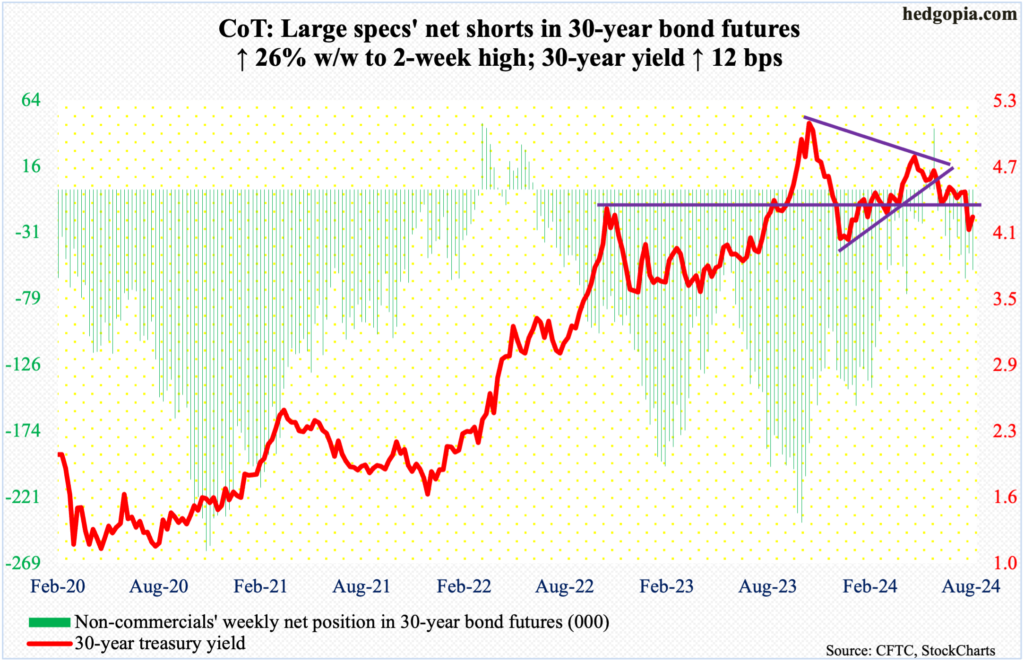
30-year bond: Currently net short 57.9k, up 11.9k.
Major US economic releases for next week are as follows.
The NFIB optimism index (July) and the producer price index (July) are on deck for Tuesday.
Small-business job openings in June tumbled five points month-over-month to 37, which was also hit in February and March and which was the lowest since January 2021.
Headline and core wholesale prices respectively rose 2.6 percent and 3.1 percent in June from a year ago.
Wednesday brings the consumer price index (July). In the 12 months to June, headline and core CPI rose three percent and 3.3 percent respectively. In 2022, the two were galloping ahead at four-decade highs of 9.1 percent (June) and 6.6 percent (September), in that order.
Retail sales (July) and capacity utilization (July) are scheduled for Thursday.
June retail sales edged lower 0.02 percent from May’s record $704.5 billion to a seasonally adjusted annual rate of $704.3 billion.
Capacity utilization increased 0.55 percent m/m in June to 78.8 percent – a nine-month high. January’s 77.2 percent was a 33-month low.
The University of Michigan’s consumer sentiment index (August, preliminary), housing starts (July) and the NAHB housing market index (August) will be reported Friday.
In July, consumer sentiment dropped 1.8 points m/m to 66.4. This was the lowest reading since last November. March’s 79.4 was the highest since July 2021.
Housing starts rose three percent m/m in June to 1.35 million units (SAAR) – a two-month high. March’s 1.3 million was the lowest since June 2020.
Homebuilder optimism slid a point m/m in July to 42, which was a seven-month low.
WTI crude oil: Currently net long 208.6k, down 38.5k.
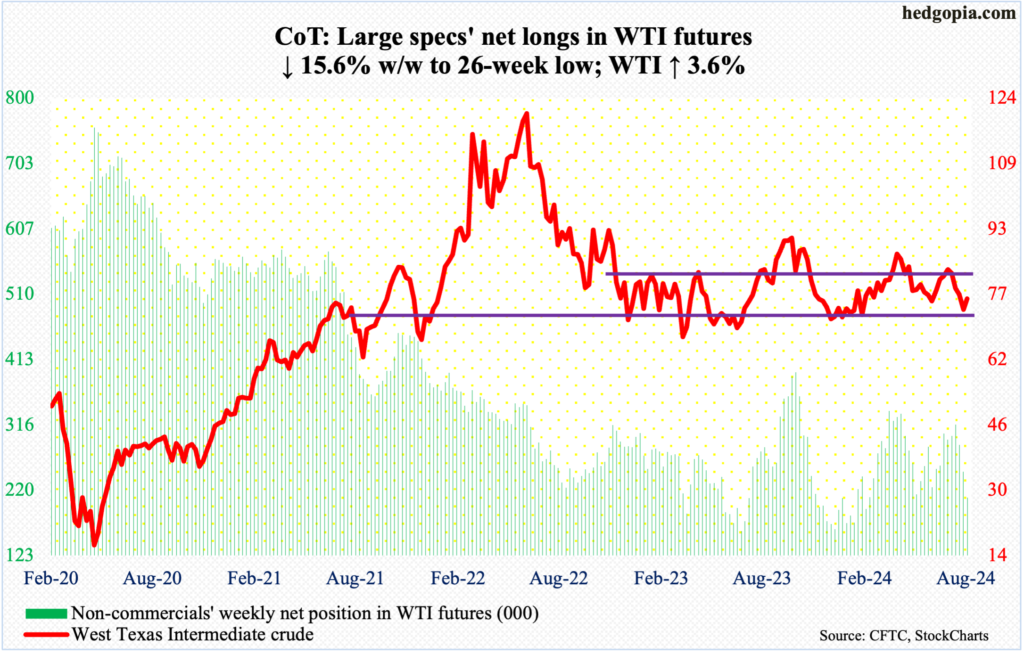
The week began with Monday’s sharp move lower to tag $71.67 intraday, which attracted bids. West Texas Intermediate crude rallied the next four sessions to end the week up 4.5 percent to $76.84/barrel.
On the weekly, a bullish hammer showed up after four consecutive weekly drops. Earlier on July 5th, the crude tagged $84.52 intraday and headed lower.
Oil bulls have an opportunity here to push WTI higher toward the upper end of a months-long range between $71-$72 and $81-$82. The lower support was successfully tested this week.
In the meantime, US crude production in the week to August 2nd rose 100,000 barrels per day to a fresh record 13.4 million b/d; earlier, 13.3 mb/d was hit 11 times from last December, including four consecutive weeks through the week to July 26th. Crude imports decreased 729,000 b/d to 6.2 mb/d. As did crude stocks, which declined 3.7 million barrels to 429.3 million barrels. Stocks of gasoline and distillates, however, rose 1.3 million barrels and 949,000 barrels respectively to 225.1 million barrels and 127.8 million barrels. Refinery utilization grew four-tenths of a percentage point to 90.5 percent.
E-mini S&P 500: Currently net long 34k, up 22k.
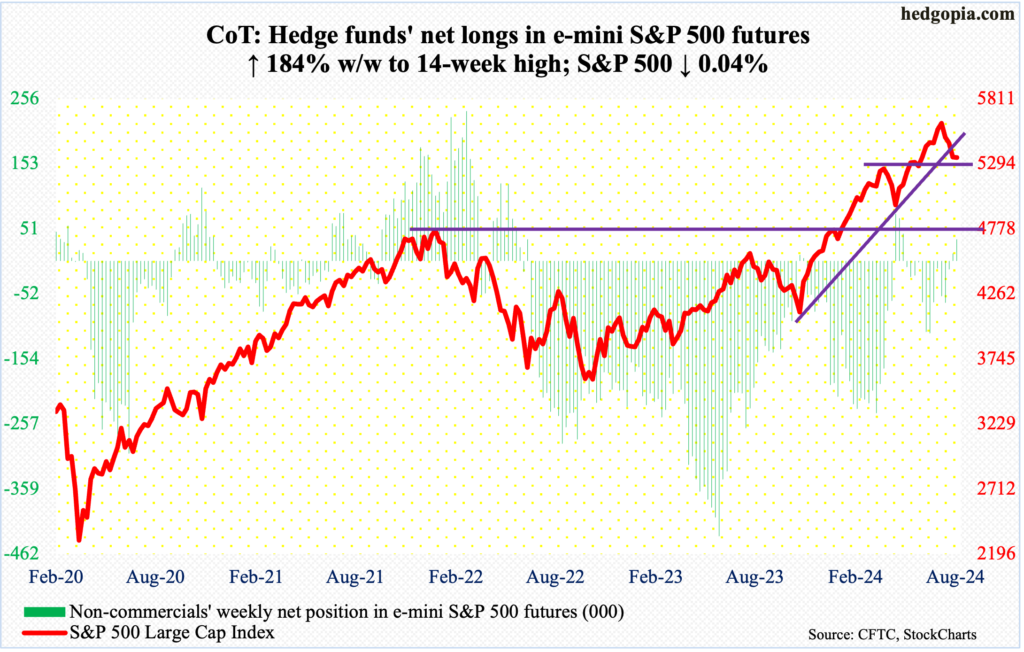
The S&P 500 was essentially unchanged this week – a close of 5344 versus last week’s 5347. Yet, this was a week that pretty much belonged to the bulls. Heading into the week, downside momentum was strong.
The large cap index peaked on July 16th at 5670 and dropped the next three weeks. This week, Monday gapped down huge to tick 5119 intraday. By that time, the index was 9.7 percent lower from the high. But the bears gave back all the gains. From Monday’s low, the S&P 500 rallied 225 points.
As things stand, there is room for the prevailing relief rally to continue (more on this here). The 50-day moving average, which was decisively lost six sessions ago, lies at 5446. After that lies horizontal resistance at 5480s. These are spots where shorts are likely to get tempted into action.
Euro: Currently net long 33.6k, up 15.8k.
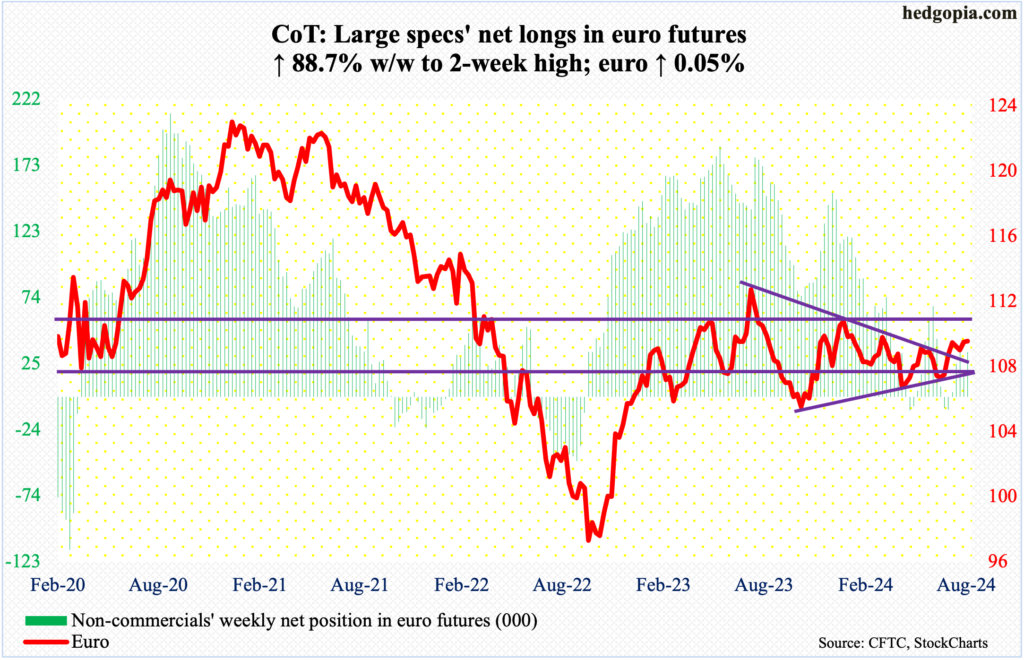
Monday’s intraday high of $1.101 would have been enough for the euro to break out of a symmetrical triangle it is in, but the bulls were unable to hang on to it. By the end of the week, the currency closed at $1.092 – just under the upper trendline, which goes back to July last year when it topped at $1.128. Trendline support from last October when the euro bottomed at $1.045 lies at $1.07.
Unless a breakout occurs soon – not likely – the path of least resistance is toward the trendline support.
Gold: Currently net long 238.7k, down 7.9k.
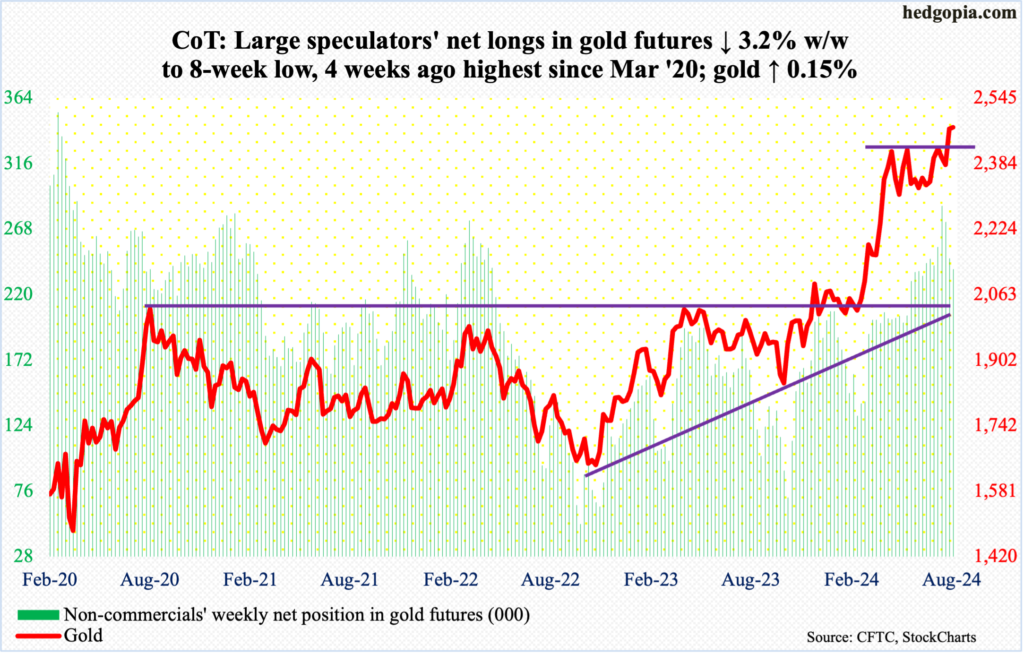
The week produced a bit for both the bulls and bears. In a volatile session Monday, gold fell as low as $2,404 and remained under prior resistance at $2,450s the next two sessions but only for gold bugs to show up in the remaining two sessions to end the week up 0.15 percent to $2,473/ounce.
Gold is under last Friday’s record $2,488 but at the same time closed above $2,450s. Near-term, odds favor the bulls, with the caveat that non-commercials with sizable long exposure continue to reduce their holdings, albeit at a measured pace.
Nasdaq (mini): Currently net long 12.6k, up 10.2k.
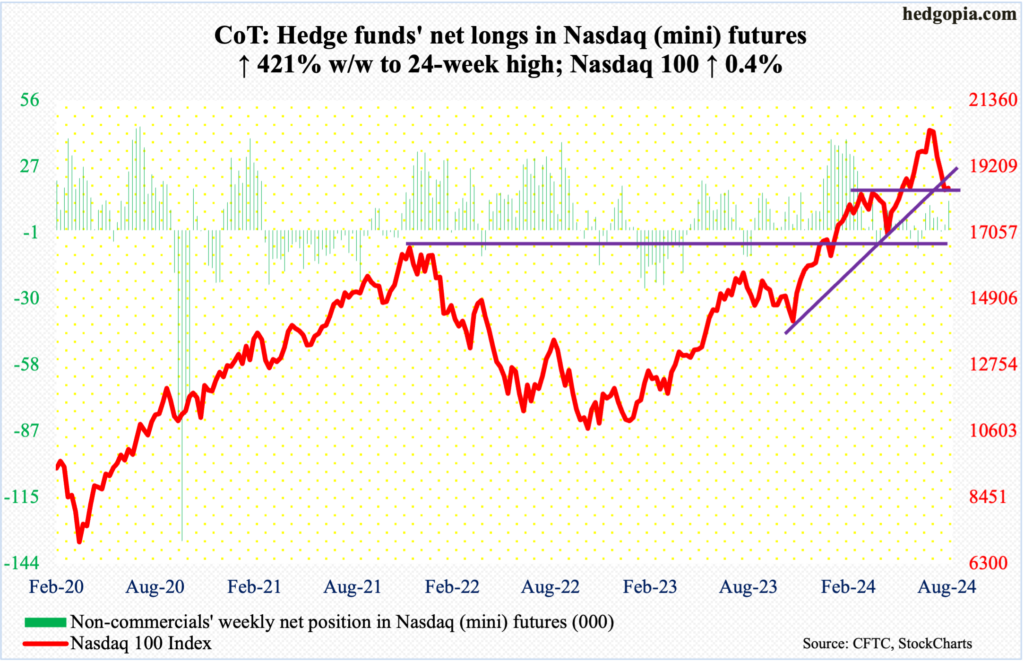
After four consecutive negative weeks, the Nasdaq 100 rose 0.4 percent this week to 18513. Tech bulls must be very happy with the outcome, as the index crawled its way back from down 5.5 percent at Monday’s low (17435). At one time in that session, the tech-heavy index was under the 200-day (17727). The average is still upward-sloping, with the 50-day now flattish. In the right circumstances for the bulls, they have a shot at the 50-day.
The Nasdaq 100 closed the week just above horizontal resistance at 18300s, which need to be defended right from the beginning next week.
Amidst this, despite Monday’s swoon and Tuesday’s tentative action in the cash, non-commercials showed conviction to add to their net longs.
Russell 2000 mini-index: Currently net short 2.6k, down 31.4k.
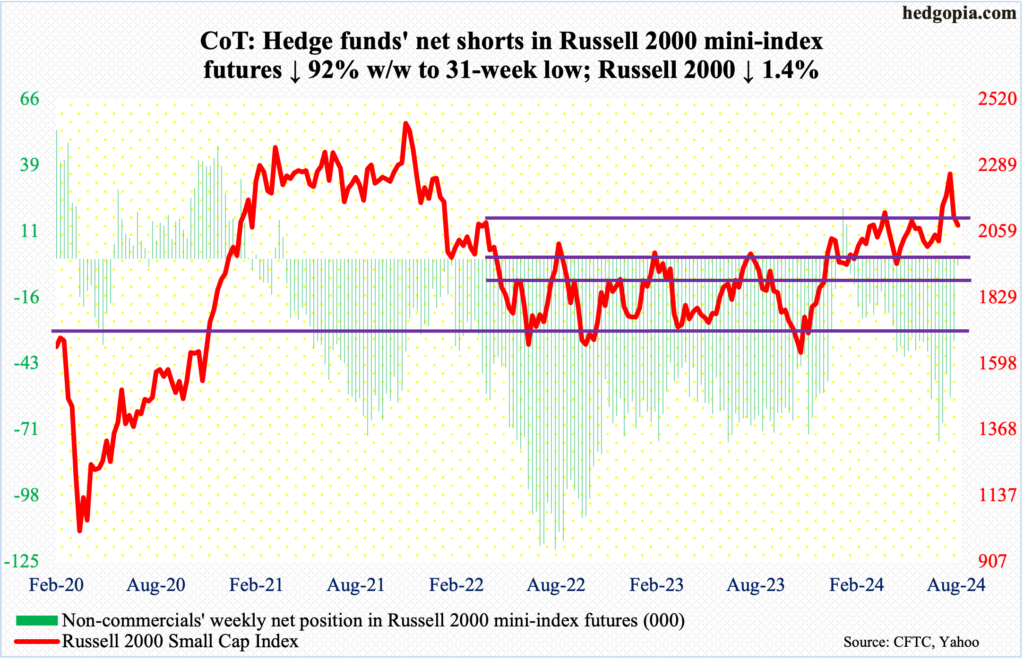
Non-commercials are now only net short 2,595 contracts. In the week to July 2nd, they were sitting on 75,435 contracts. These traders aggressively cut back as the cash rallied massively post-July 11th CPI report for July; the Russell 2000 closed at 2052 on the 10th and at 2125 on the 11th.
Previously, the small cap index has had trouble at 2100 going back to early March. Plus, 2144 represents a 61.8-percent Fibonacci retracement of the drop between the November 2021 peak (2459) and the June 2022 trough (1641); 2100 also represents a measured-move price target post-breakout at 1900 last December, as the index was trapped between 1700 and 1900 going back to January 2022.
Unless non-commercials go net long eventually, the tailwind they provided to the cash as they reduced net shorts is now gone. This week, the Russell 2000 fell 1.4 percent to 2081, having earlier dropped to 1993 intraday Monday; the 200-day (1989 at the time) was successfully tested. The index now remains just below the 50-day at 2097. So, 2100 it is – the hurdle that small-cap bulls need to win over.
US Dollar Index: Currently net long 16.1k, down 822.
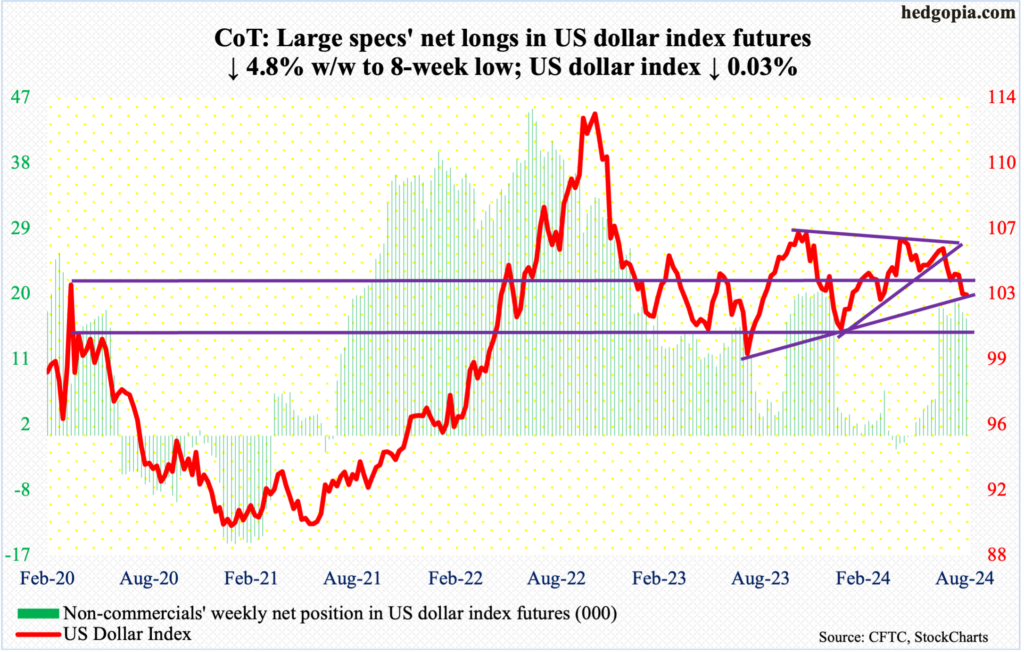
Six or seven weeks ago, dollar bulls were denied at a falling trendline from last October when it peaked at 107.05. Five weeks ago, it fell out of a symmetrical triangle, made up also of a rising trendline from last December when the US dollar index bottomed at 100.32.
Intraday Monday (this week), the index decisively breached horizontal support at 103-104, which goes back to December 2016, falling as low as 101.97, but, as it turns out, that low kissed a rising trendline from July last year and it held, closing the week at 102.96.
Odds probably favor the bulls here.
VIX: Currently net short 43.5k, down 6.1k.
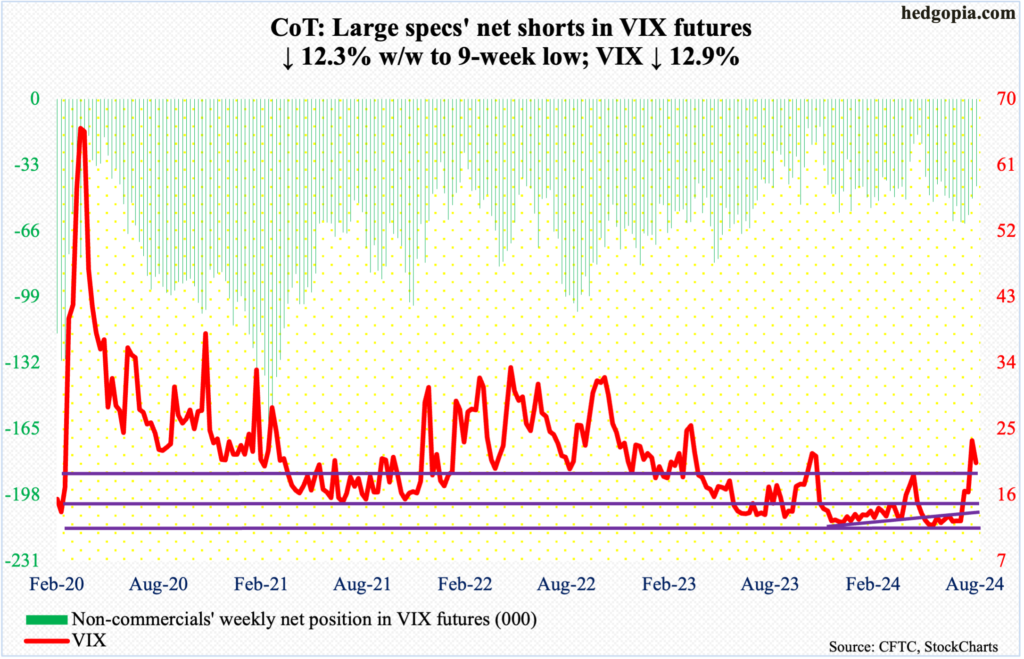
VIX was volatile to say the least. It rallied as high as 65.73 (no typo) on Monday but only to close out the week at 20.37. For reference, the volatility index hit 89.53 in October 2008 and 85.47 in March 2020. Those were tough times. Things are nowhere near as tough. It remains to be seen if VIX is trying to forecast turbulent times ahead.
For now, VIX is back to a 20 handle. For volatility bulls, 19 is a must-save. Inability to save the level opens the door toward the mid-teens.
Thanks for reading!
More By This Author:
Should Relief Rally Not Show Up On Time, Logical To Conclude This Selloff Is Different
Reading The Future With Futures: Latest CoT Report
Nasdaq 100-Russell 2000 Ratio Approaching Crucial Retest; Small-Cap Bulls Should Hope For Breach


Comments
Log in or sign up to join the conversation.